


Slow change may pull us apart
When the light gets into your heart, baby
Don’t you, forget about me
Don’t, don’t, don’t, don’t
Don’t you, forget about me
“Don’t You (Forget About Me)”- Simple Minds, from the soundtrack of The Breakfast Club
John Hughes’ iconic 1986 film The Breakfast Club is about youth being typecast and overlooked for who they really are. Each character fits a stereotype on the surface and is judged by their elders and peers as nothing more than a label. Discovering that they are all far more complex than the labels ascribed to them, the Brat Pack writes to Vice Principal Vernon “You see us as you wanna see us, in the simplest terms, with the most convenient definitions. You see us as a brain, an athlete, a basket case, a princess, and a criminal.”
Just like “these children”, the sectors of the S&P 500 are often typecast and overlooked, being seen in the “simplest terms, with the most convenient definitions”.
In today’s market, the Technology sector is clearly Molly Ringwald’s popular “princess”, seemingly unable to do wrong and demanding the masses’ attention. But just like the princess, who appears perfect on the surface but faces her own challenges, Tech’s overall strength masks weakness in certain industry groups within the sector.
More importantly, there is a lot more happening in this market outside of Tech that shouldn’t be overlooked. Sectors that are often written off as weak or volatile, like the “brain” or the “basket case”, contain industry groups and individual stocks that have had impressive performance. It is as if these sectors are joining Simple Minds to sing “don’t you, forget about me!”.
“Giving Everything Inside and Out”: Sector Earnings Trends
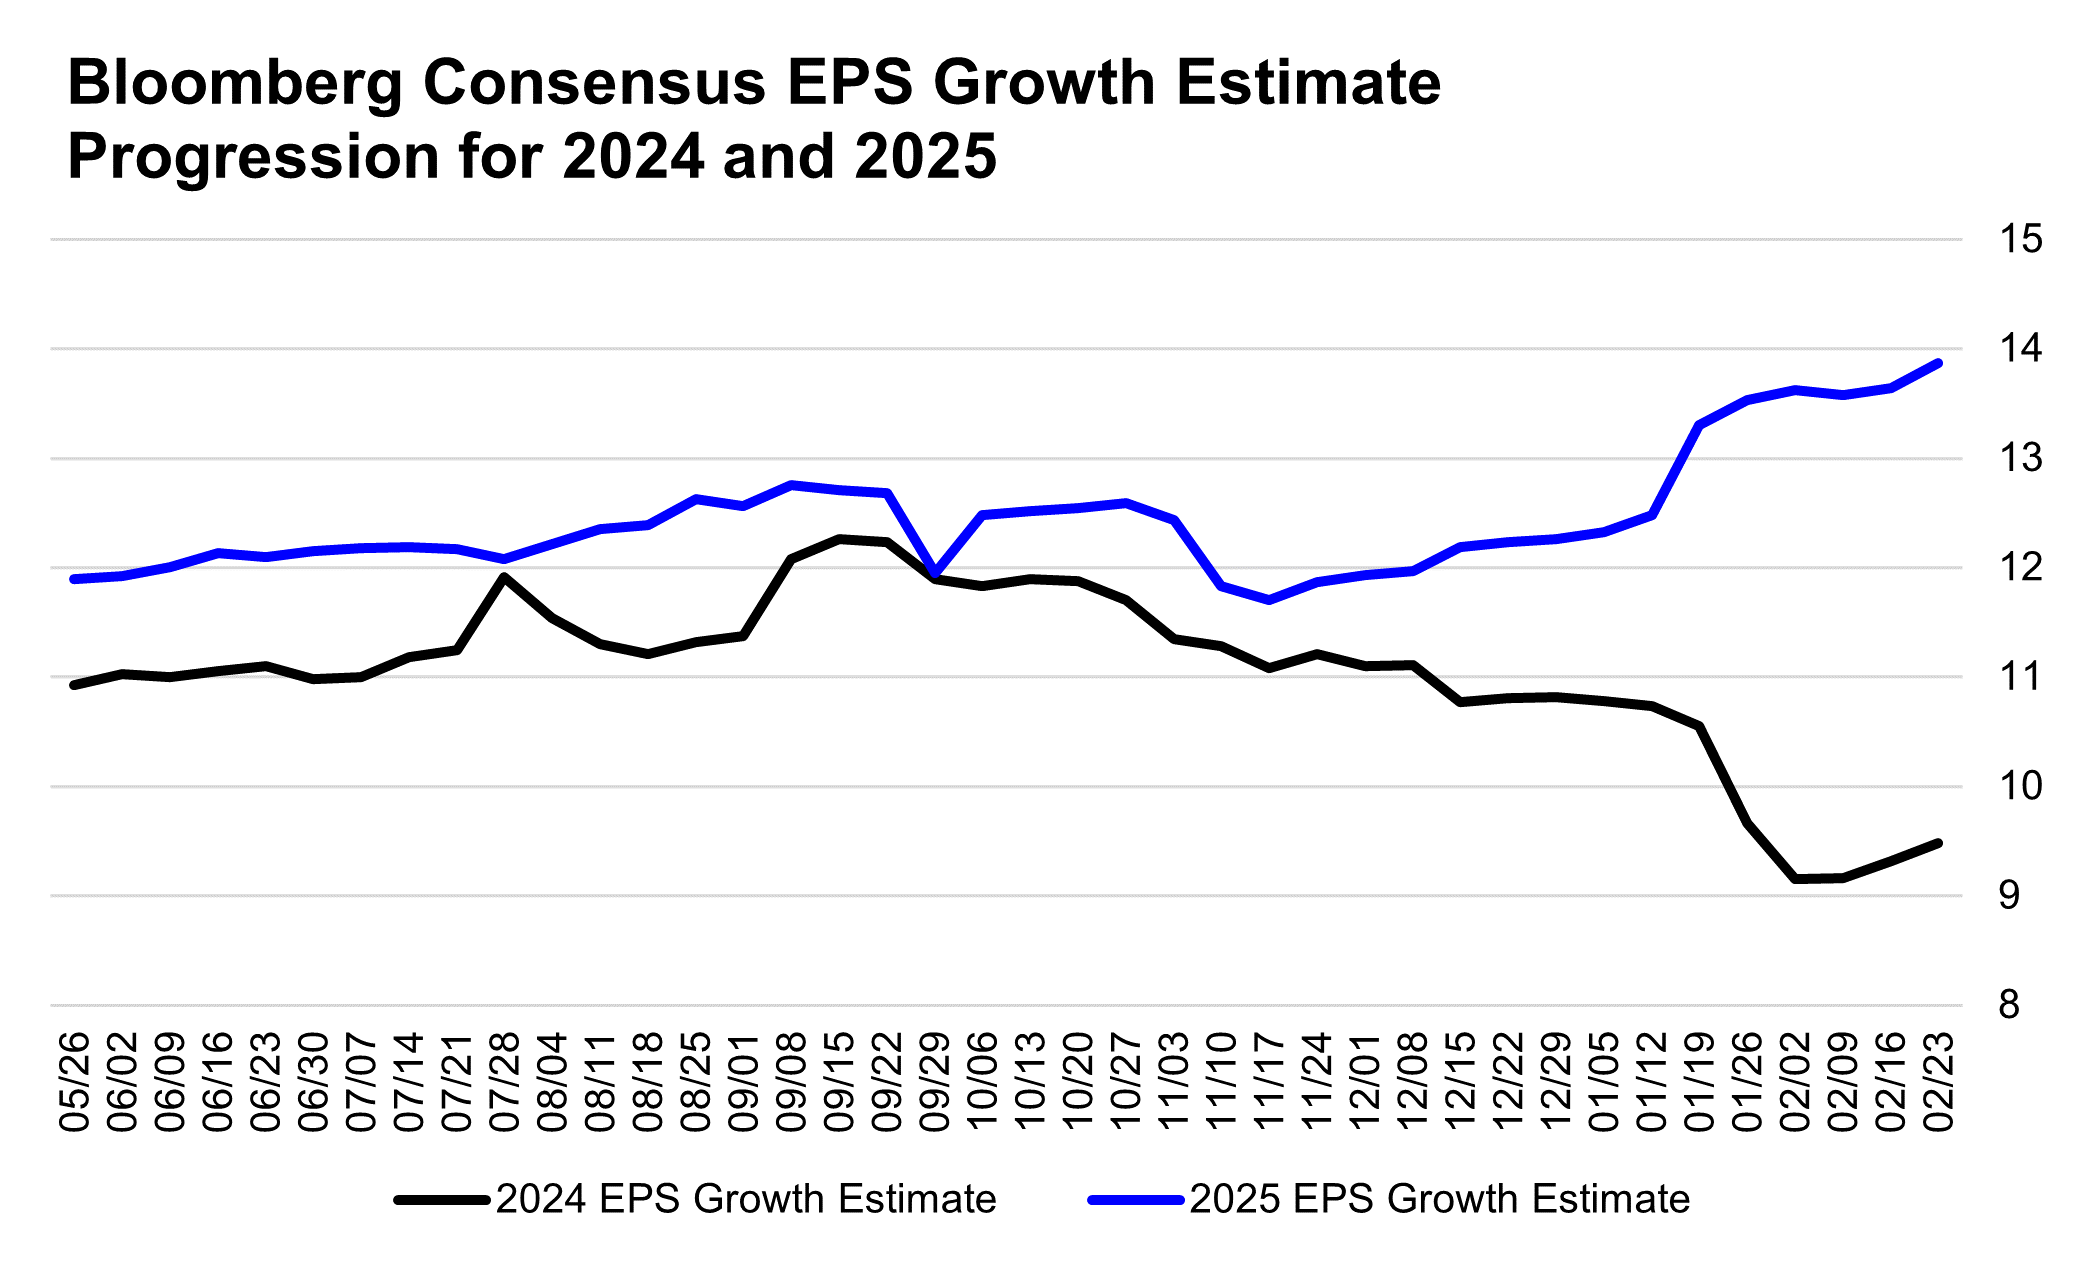
Before looking at the relative performance charts of various sectors and industry groups (we highlight Technology, Industrials, and Health Care), we check in with earnings estimates for the S&P 500 and its sectors, using the current Bloomberg Intelligence consensus forecasts.
There are a few important takeaways from the three charts below.
- More back-end loaded forecasts: overall 2025 EPS estimates have remained fairly static, but analysts have cut 2024 growth forecasts and raised 2025 growth forecasts. This creates a more “back-end loaded” forecasts looking out two years, which increases the uncertainty of fulfilling these estimated growth rates.
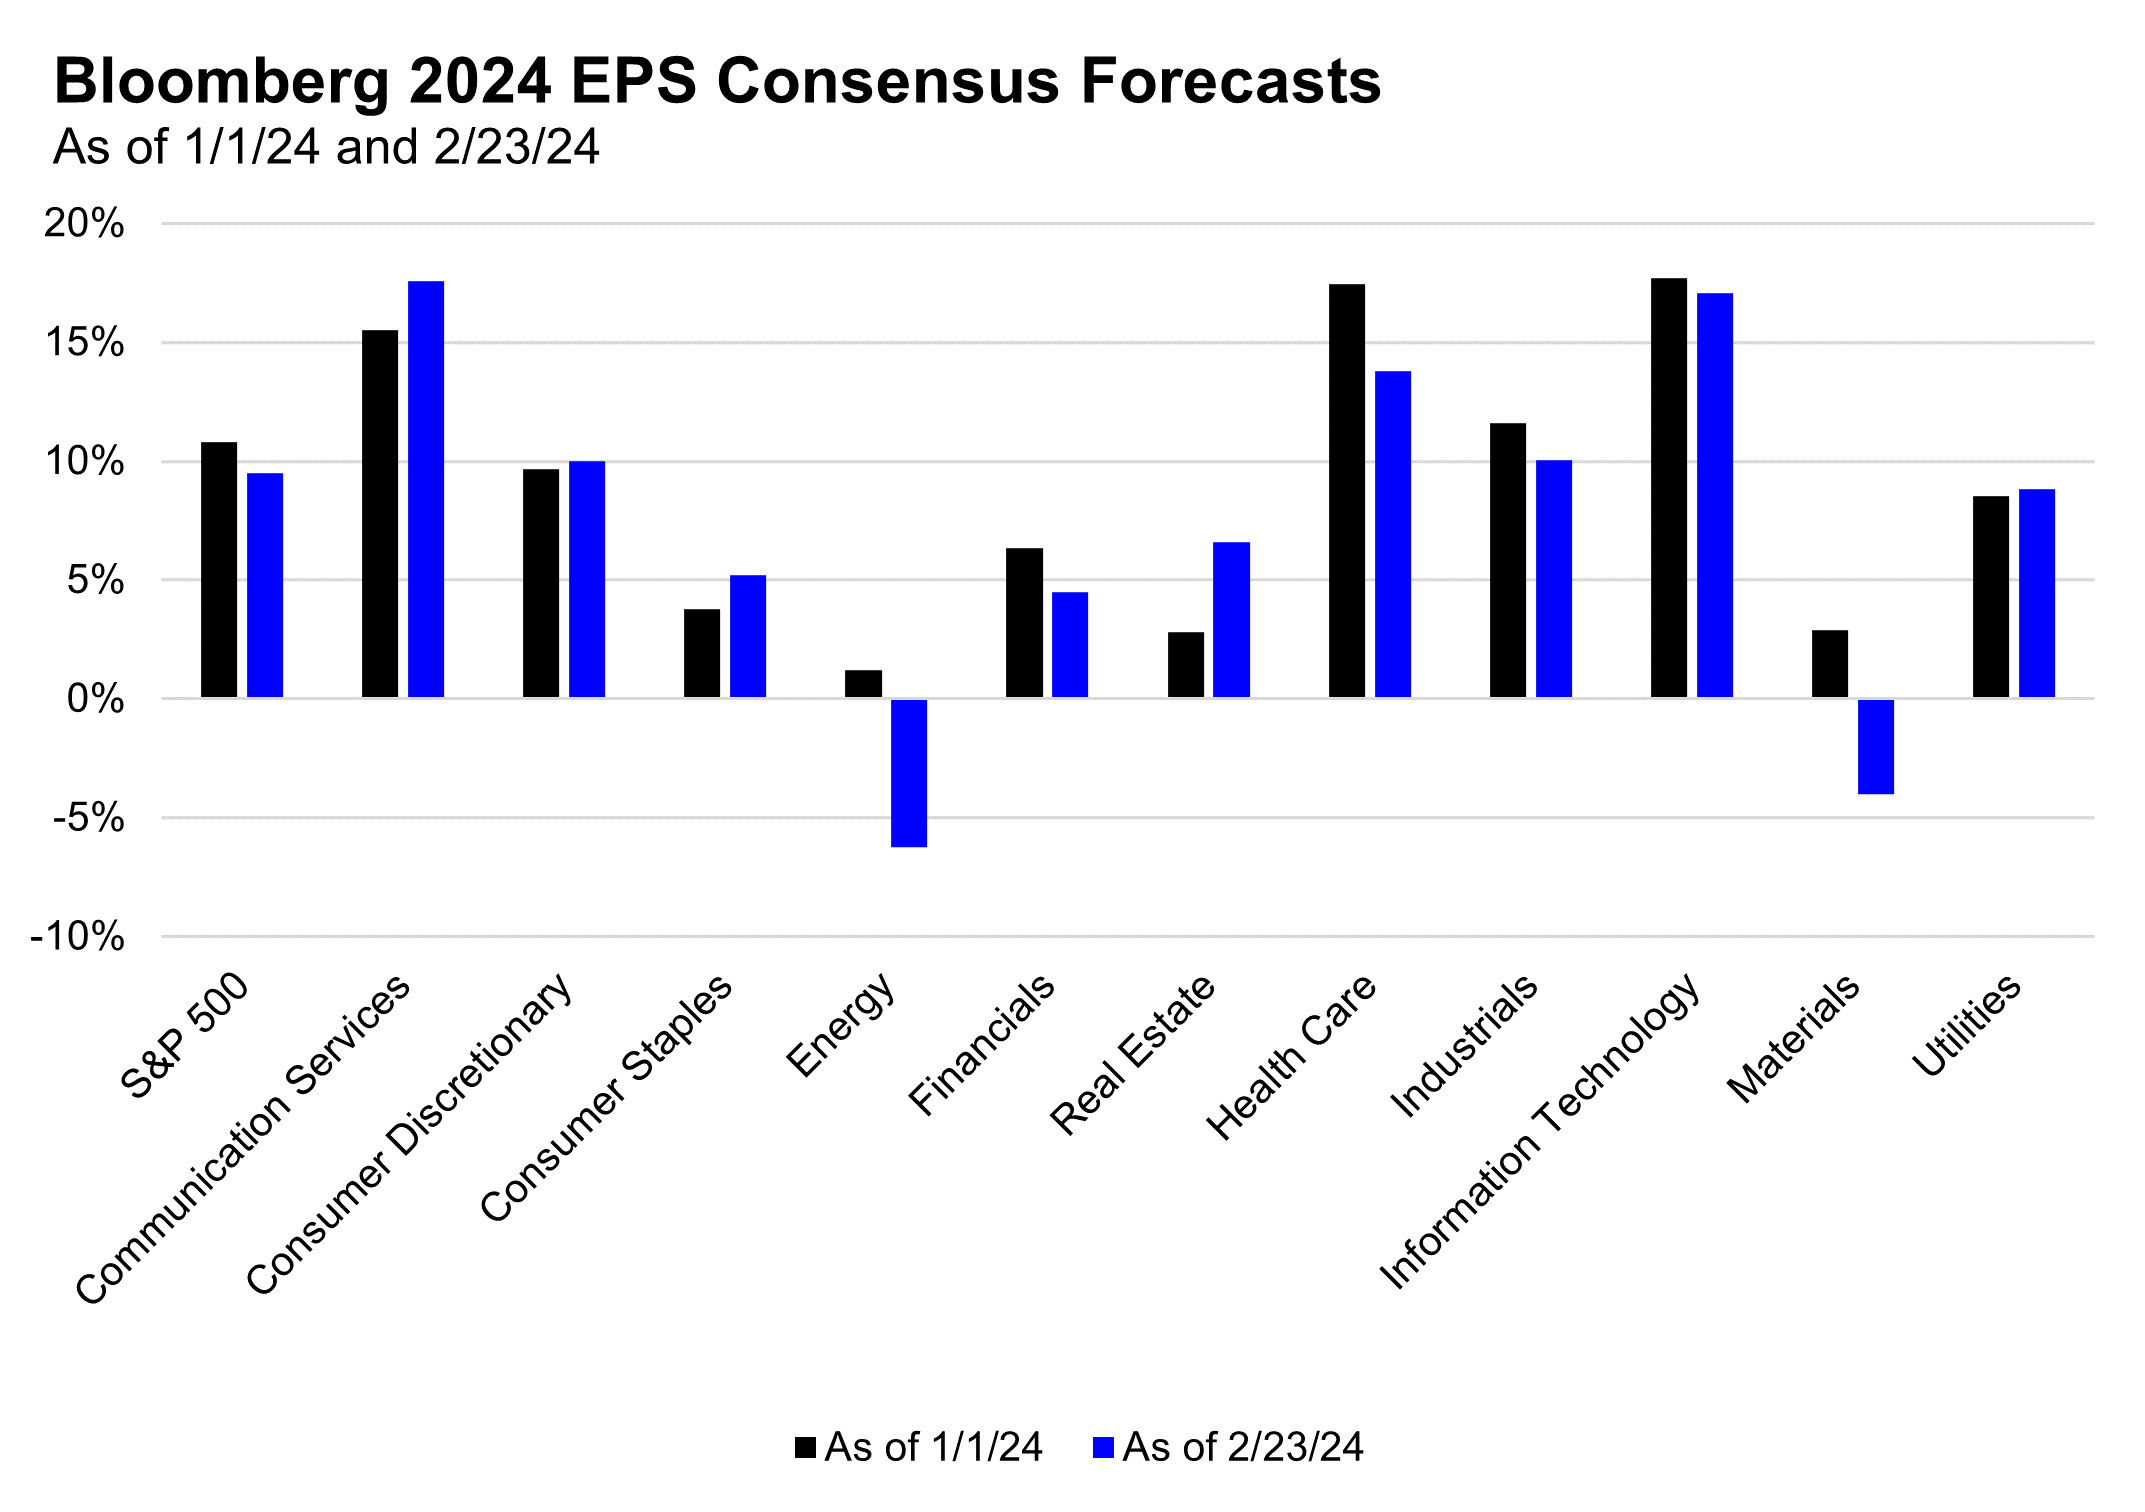
- Only three sectors have seen EPS forecasts increase for 2024 YTD: Communication Services, Consumer Staples, and Real Estate have seen estimates rise, while all other sectors have seen estimates for this year’s EPS growth trimmed. Even Technology has seen its 2024 growth estimates cut slightly, while commodity sensitive sectors (Energy and Materials) have seen the largest downward revisions (helping to explain these sectors’ underperformance year to date).
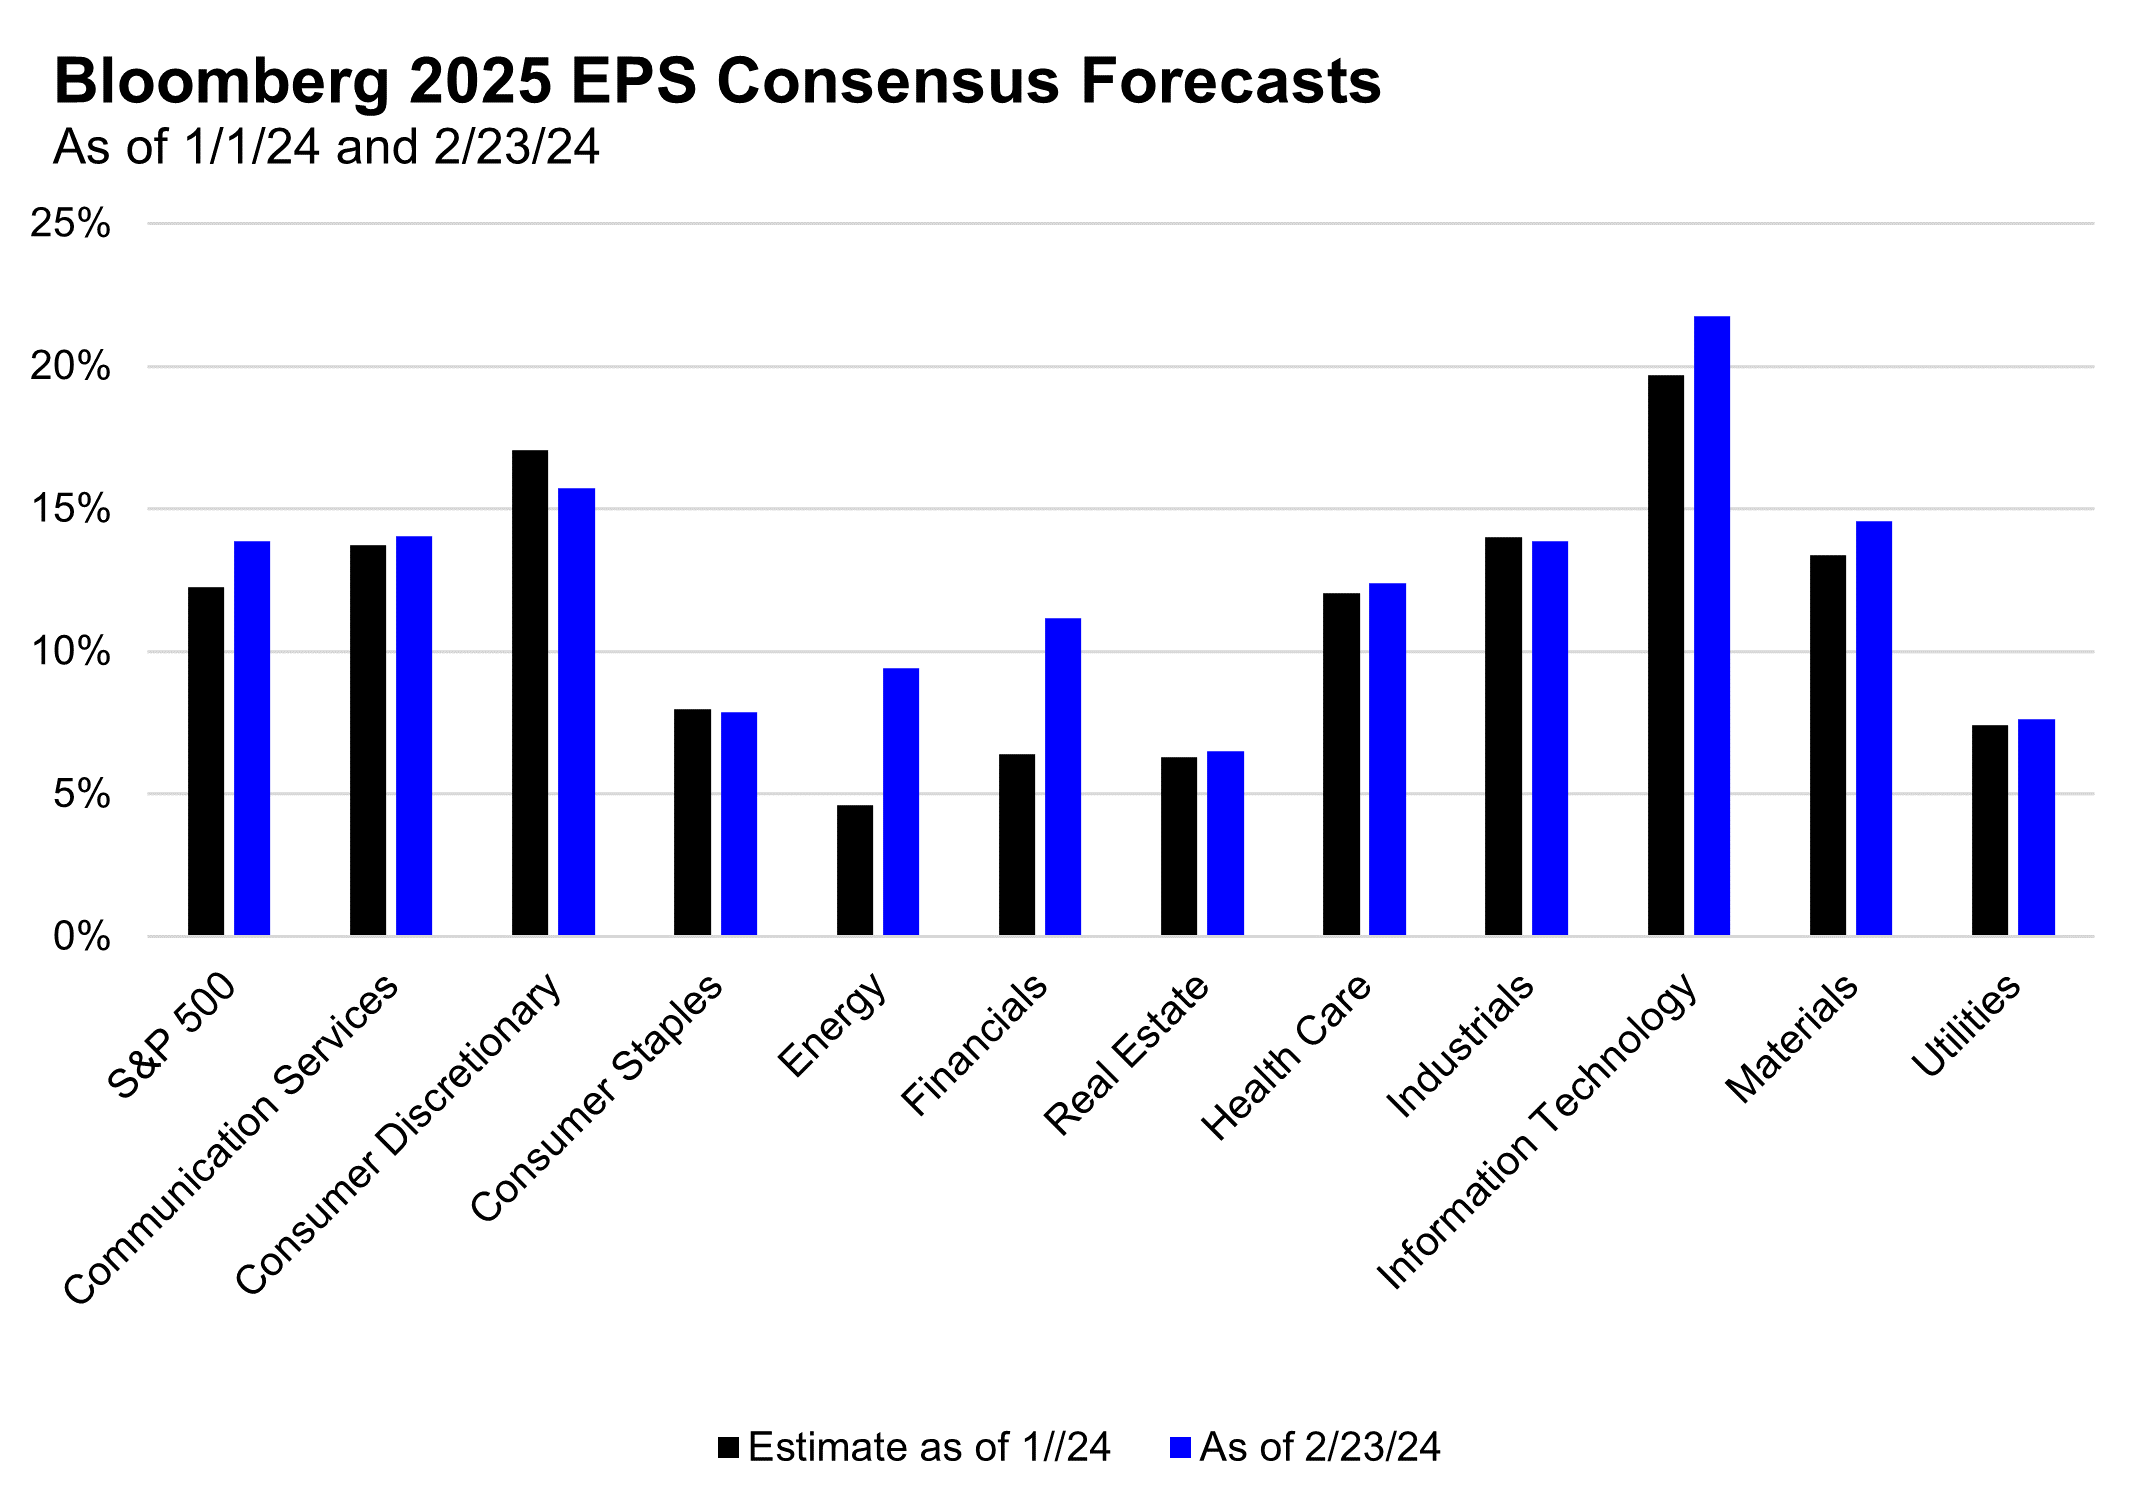
- 2025 Estimates Revisions Broadly Higher: The 2025 estimate revisions higher have been driven primarily by Technology, Energy and Financials, while Consumer Discretionary is the one sector to see estimate cuts.
“I’ll Be Alone, Dancing, You Know it Baby”: Technology Sector Performance Trends
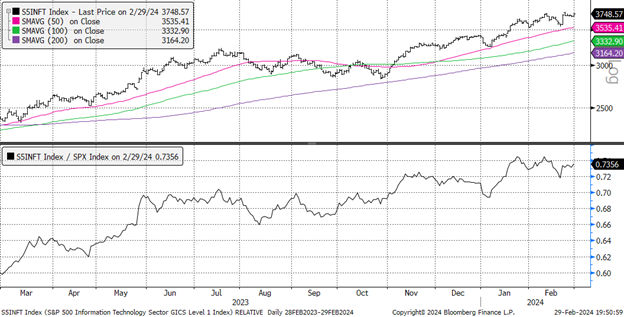
As seen in the charts below, the Technology sector has been exhibiting strong outperformance over the S&P 500. It remains in a strong relative uptrend, accompanied only by Communication Services in exhibiting such powerful absolute and relative trends.
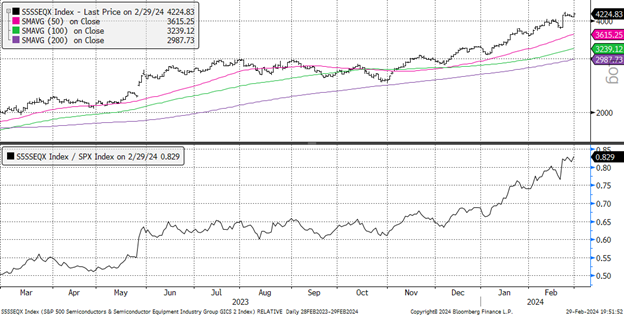
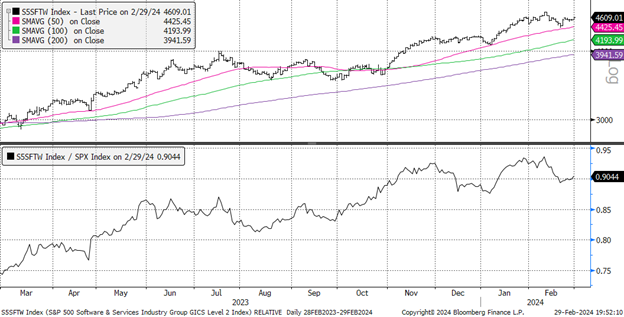
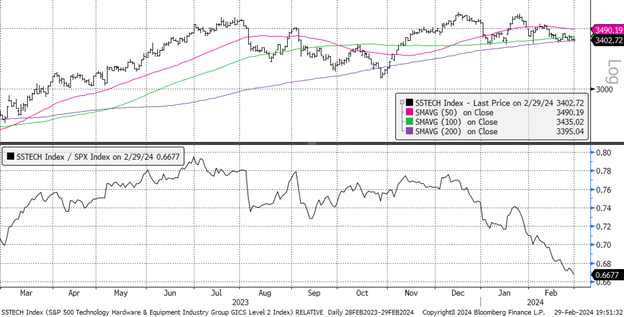
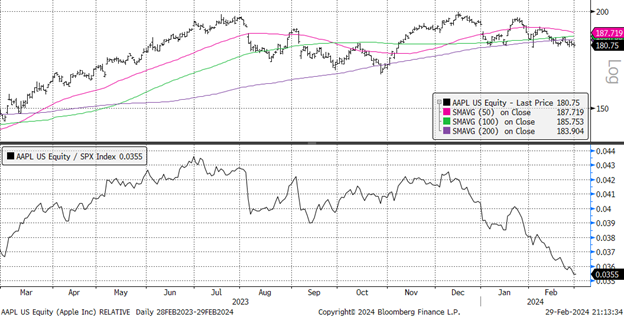
There is nuance to this outperformance, with the strength driven by the Semiconductor and Software industry groups, while the Hardware industry group is lagging significantly. Each of these industry groups has their “mega” drivers of performance: Semi strength boosted by Nvidia (NVDA), Software strength boosted by Microsoft (MSFT), and Hardware relative weakness dragged down by Apple (AAPL).
Note the top panel in each chart below shows the absolute performance of each sector/industry group, while the bottom panel in each chart shows the relative performance of each sector/industry group vs. the S&P 500, with an upward sloping line representing that sector/industry outperforming the S&P 500 and a downward sloping line representing that sector/industry underperforming the S&P 500.
S&P 500 Technology Sector Absolute (Top) and Relative to the S&P 500 (bottom)
S&P 500 Semiconductor Industry Absolute (Top) and Relative to the S&P 500 (bottom)
S&P 500 Software Industry Absolute (Top) and Relative to the S&P 500 (bottom)
S&P 500 Technology Hardware Industry Absolute (Top) and Relative to the S&P 500 (bottom)
AAPL (Top) and Relative to the S&P 500 (bottom)
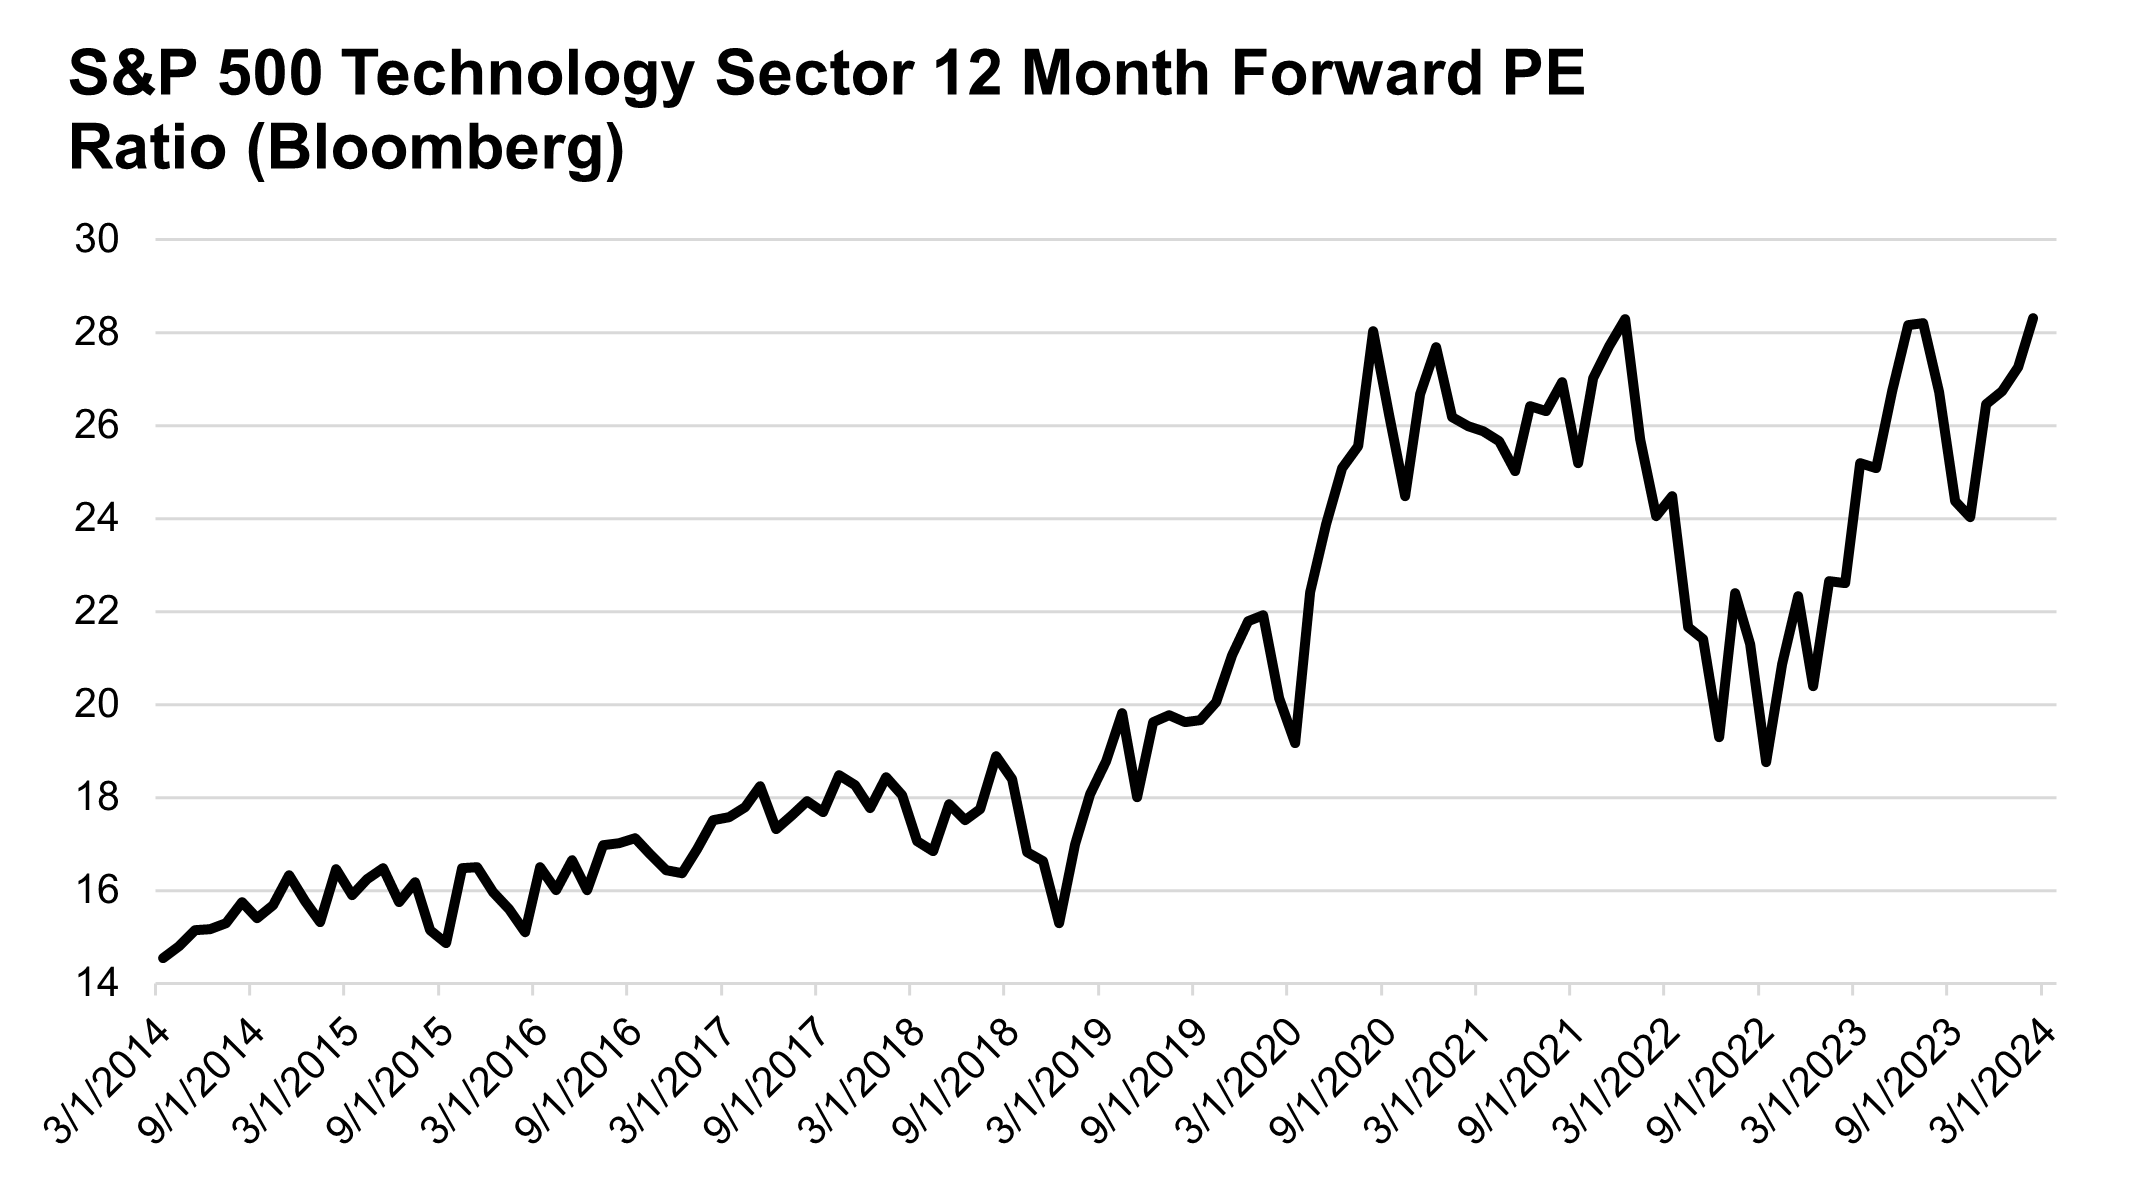
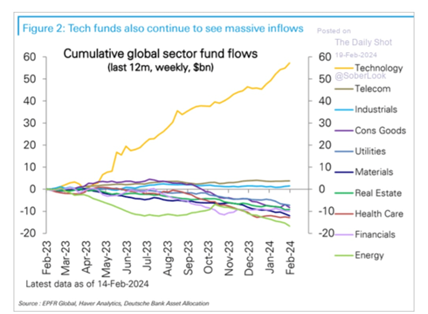
Overall, our view on Technology is one to respect the uptrend, momentum, and positive earnings revisions (though back-end loaded!) in the short run, but to be aware that valuations have become stretched (back to 2021 highs) and positioning has become crowded, as shown in the charts below.
“I Won’t Harm You or Touch Your Defenses”: Industrial Sector Performance Trends
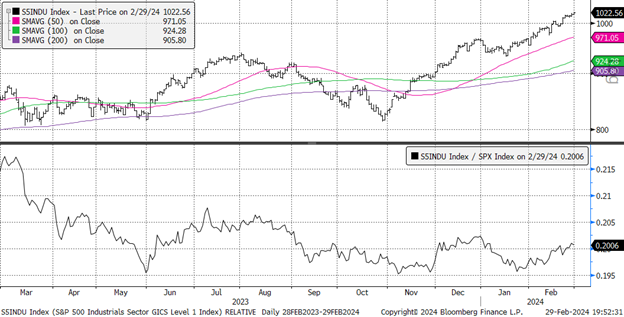
As seen in the charts below, the Industrial sector has displayed powerful absolute performance coming out of the October lows. To start the year, the sector struggled to keep pace with the S&P but has recently begun to outperform the overall market.
This outperformance has been dulled by lagging performance in the Aerospace & Defense industry group, dragged down by Boeing’s woes and weak relative performance out of the large defense contractors.
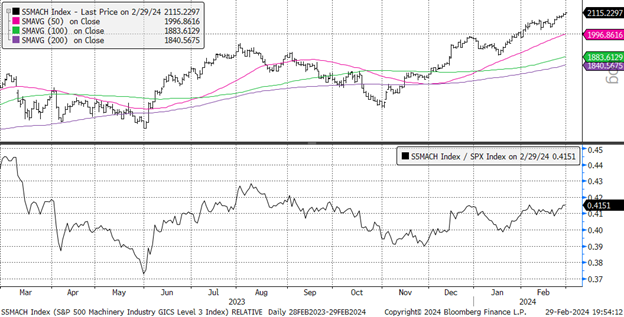
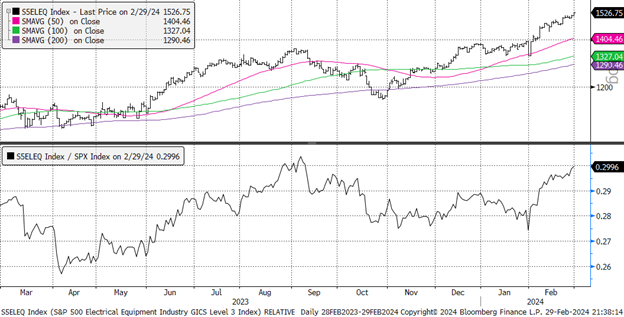
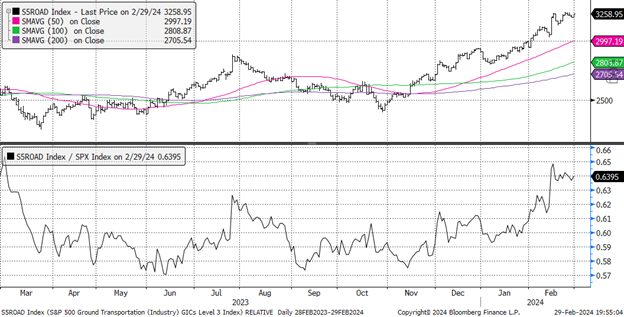
Adding to stronger sector performance have been cyclical areas such as Machinery, Electrical Equipment, and Road & Rail, appearing to confirm last week’s work looking at the cyclical recovery brewing in PMIs. Drivers such as technology infrastructure and fiscal stimulus are helping to propel stronger earnings growth and optimism amongst stocks in these sectors.
S&P 500 Industrial Sector Absolute (Top) and Relative to the S&P 500 (bottom)
S&P 500 Aerospace & Defense Industry Absolute (Top) and Relative to the S&P 500 (bottom)

S&P 500 Machinery Industry Absolute (Top) and Relative to the S&P 500 (bottom)
S&P 500 Electrical Equipment Industry Absolute (Top) and Relative to the S&P 500 (bottom)
S&P 500 Road & Rail Industry Absolute (Top) and Relative to the S&P 500 (bottom)
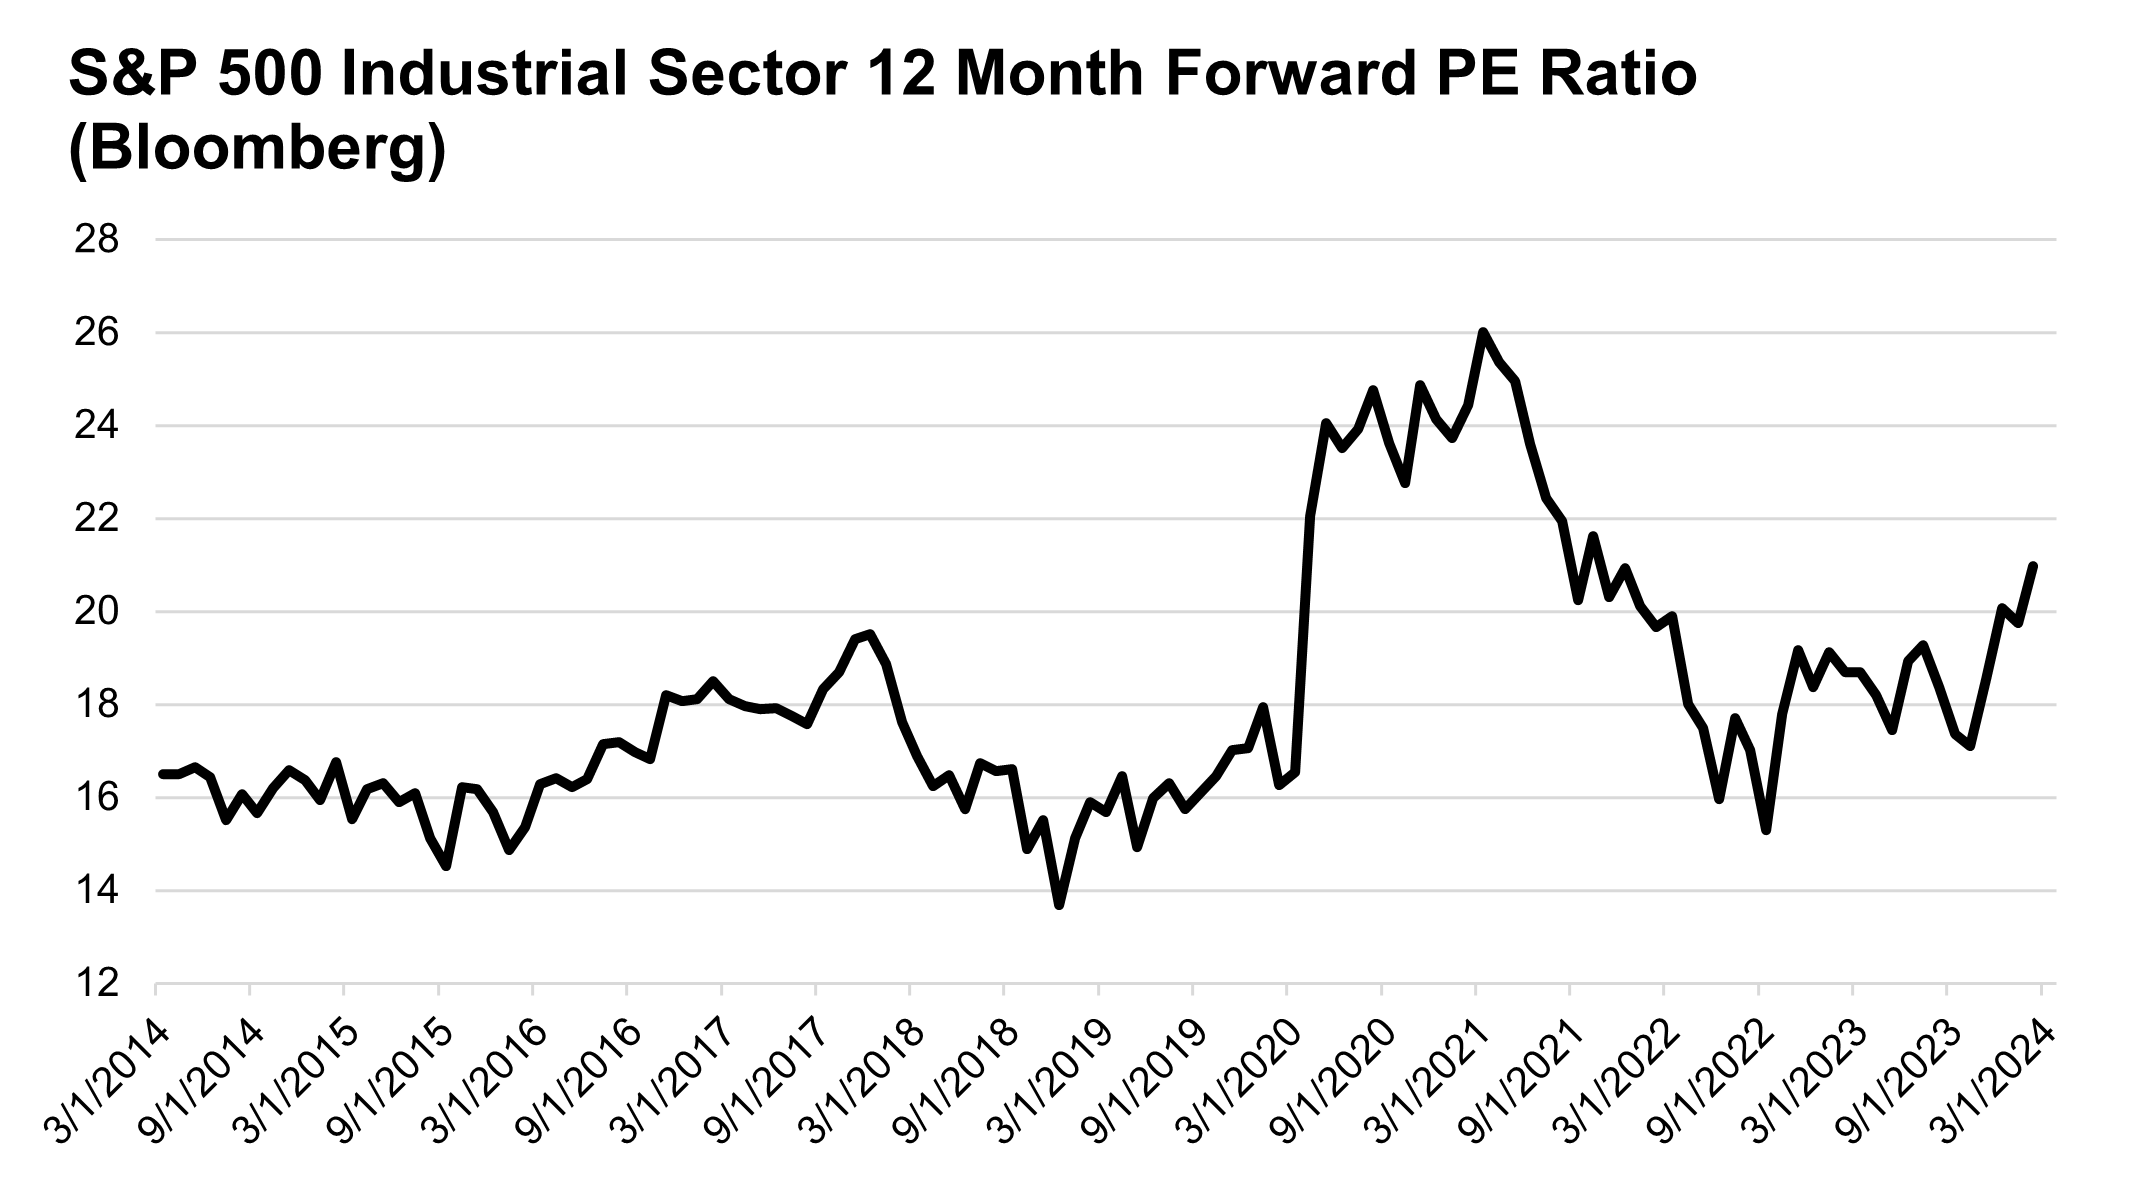
Overall, the biggest challenge for the Industrial sector could be forward valuations, which are very stretched versus history (note the high valuations during 2020/2021 were due to a collapse in earnings and the boost from ultra-easy monetary policy, meaning we do not think these valuations can be used as a reasonable baseline for sustainable future valuations). However, just like for the market, valuation is not a helpful timing tool, meaning optimism around fiscal stimulus, the technology infrastructure build-out, and a nascent cyclical recovery could keep these (typically mean-reverting) valuations elevated.
“Rain Keeps Falling, Rain Keeps Falling Down”: Health Care Sector Performance Trends
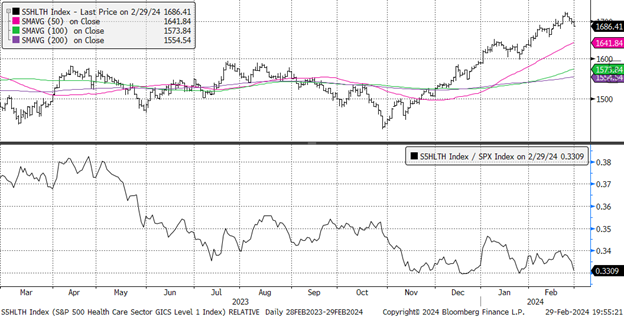
Health Care exhibited strong absolute performance to start 2024, but late this week began to lose momentum. This has led to an end to Health Care’s nascent relative performance recovery, as the relative performance chart below has turned lower.
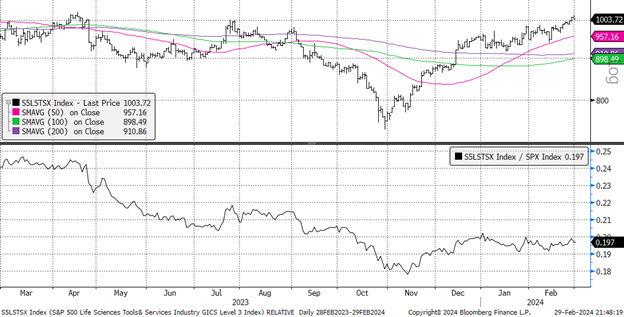
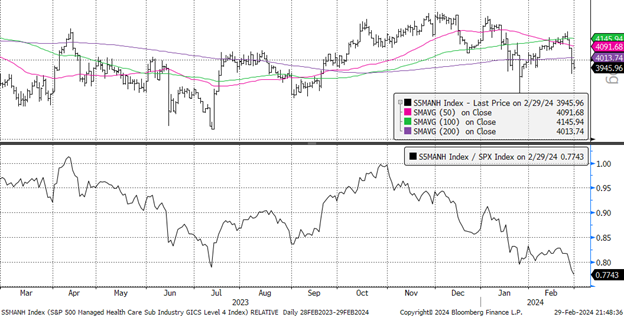
This weakness has been fairly broad based with Pharma, Biotech, and Managed Care (health insurers) all turning lower, while Life Sciences & Tools remains one of last hold-outs for stronger relative performance.
For those hoping (ourselves included) that Health Care’s weak 2023 performance, sector outflows, and flip to positive EPS growth in 2024 could set up for better relative performance this year may have to be patient given these weakening relative performance trends. This weaker relative performance appears to be confirmed by 2024 EPS growth revisions for the sector, which have gone from 17% to start the year to 13.8% today.
S&P 500 Health Care Sector Absolute (Top) and Relative to the S&P 500 (bottom)
S&P 500 Pharma & Biotech Industry Absolute (Top) and Relative to the S&P 500 (bottom)

S&P 500 Life Sciences & Tools Industry Absolute (Top) and Relative to the S&P 500 (bottom)
S&P 500 Managed Care Industry Absolute (Top) and Relative to the S&P 500 (bottom)
“Tell Me Your Troubles and Doubts”: Conclusion
As can be seen in the three sectors highlighted above, there are nuances to both weak and strong sectors, meaning we can’t use the “simplest terms, with the most convenient definitions” when looking for investment opportunities. Within each sector, even those overlooked ones, there are opportunities to seek out and areas to avoid, which this sector analysis aids us in identifying.
So grab your lipstick, borrow a diamond earning, and cut the sleeves off a flannel, because if The Breakfast Club taught us anything, there is always more than meets the eye.
Index Information: All returns represent total return for stated period. S&P 500 is a total return index that reflects both changes in the prices of stocks in the S&P 500 Index as well as the reinvestment of the dividend income from its underlying stocks. Dow Jones Industrial Average (DJ Industrial Average) is a price-weighted average of 30 actively traded blue-chip stocks trading New York Stock Exchange and Nasdaq. The NASDAQ Composite Index measures all NASDAQ domestic and international based common type stocks listed on the Nasdaq Stock Market. Russell 2000 is an index that measures the performance of the small-cap segment of the U.S. equity universe. MSCI International Developed measures equity market performance of large, developed markets not including the U.S. MSCI Emerging Markets (MSCI Emerging Mkts) measures equity market performance of emerging markets. Russell 1000 Growth Index measures the performance of the large- cap growth segment of the US equity universe. It includes those Russell 1000 companies with relatively higher price-to-book ratios, higher I/B/E/S forecast medium term (2 year) growth and higher sales per share historical growth (5 years). The Russell 1000 Value Index measures the performance of the large cap value segment of the US equity universe. It includes those Russell 1000 companies with relatively lower price-to-book ratios, lower I/B/E/S forecast medium term (2 year) growth and lower sales per share historical growth (5 years). The BBB IG Spread is the Bloomberg Baa Corporate Index that measures the spread of BBB/Baa U.S. corporate bond yields over Treasuries. The HY OAS is the High Yield Option Adjusted Spread index measuring the spread of high yield bonds over Treasuries.
Sector Returns: Sectors are based on the GICS methodology. Returns are cumulative total return for stated period, including reinvestment of dividends.
The views and opinions included in these materials belong to their author and do not necessarily reflect the views and opinions of NewEdge Capital Group, LLC.
This information is general in nature and has been prepared solely for informational and educational purposes and does not constitute an offer or a recommendation to buy or sell any particular security or to adopt any specific investment strategy.
NewEdge and its affiliates do not render advice on legal, tax and/or tax accounting matters. You should consult your personal tax and/or legal advisor to learn about any potential tax or other implications that may result from acting on a particular recommendation.
The trademarks and service marks contained herein are the property of their respective owners. Unless otherwise specifically indicated, all information with respect to any third party not affiliated with NewEdge has been provided by, and is the sole responsibility of, such third party and has not been independently verified by NewEdge, its affiliates or any other independent third party. No representation is given with respect to its accuracy or completeness, and such information and opinions may change without notice.
Investing involves risk, including possible loss of principal. Past performance is no guarantee of future results.
Any forward-looking statements or forecasts are based on assumptions and actual results are expected to vary from any such statements or forecasts. No assurance can be given that investment objectives or target returns will be achieved. Future returns may be higher or lower than the estimates presented herein.
An investment cannot be made directly in an index. Indices are unmanaged and have no fees or expenses. You can obtain information about many indices online at a variety of sources including: https://www.sec.gov/answers/indices.htm.
All data is subject to change without notice.
© 2026 NewEdge Capital Group, LLC

