


Got a machinehead, it’s better than the rest
Green to red, machinehead
Got a machinehead, it’s better than the rest
Green to red
“Machinehead”, Bush
The U.S. equity market has “got a machinehead” and, based on this week’s price action, “it’s better than the rest”.
The U.S. equity market was propelled higher this week by another impressive earnings report from Nvidia (NVDA), the ultimate “machinehead” and the dominant provider of advanced semiconductors that are critical to the buildout of Artificial Intelligence (AI) computing power infrastructure.
NVDA certainly is a unique upside case in this market, with a truly unprecedented step-change higher in its earnings power over the last 12 months. This time last year, the Street was expecting NVDA to deliver $6/share in earnings for the current fiscal year 2025. Today, that estimate is nearly $24/share. It is hard to find many examples of other 4x increases in earnings estimates for companies of this size!
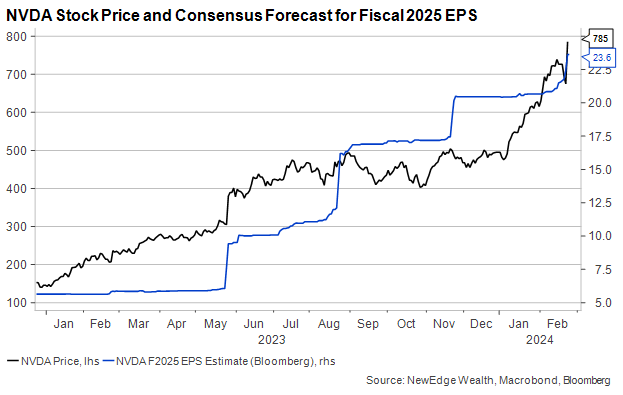
The jump higher in earnings power for NVDA is a function of the ongoing AI arms race by hyperscale datacenter players. Sales to Microsoft, Meta, Amazon, and Google currently account for 30% of NVDA’s revenue (one man’s sales is another man’s CapEx!), a relatively high degree of concentration and a key watch item for the sustainability of the current earnings power in future years.
Given NVDA’s dominant technology advantage in AI-enabling chips and software, the spoils of this AI arms race have been relatively concentrated in NVDA and a few other related players (semiconductor equipment, specialized electrical equipment, etc.), however there are some broader cyclical dynamics at play of which investors should be conscious.
“I walk from my machine [tools]”: The Semiconductor Cycle
Thanks in large part to strong demand for AI-related semiconductors, we are seeing a rebound in overall semiconductor sales. Semiconductors were in a slump over 2022 and 1H23 due to overbuying and overinvestment during the supply chain whipsaws of the post-pandemic period, resulting in inventory overhangs and a period of weak demand.
As can be seen in the chart below, semiconductor sales growth (as measured by the SOX Index) started to rebound in the summer of 2023, and has been confirmed by a recovery in South Korean exports (which are typically highly correlated to global semiconductor sales given South Korea’s major semi players, Samsung and SK Hynix).
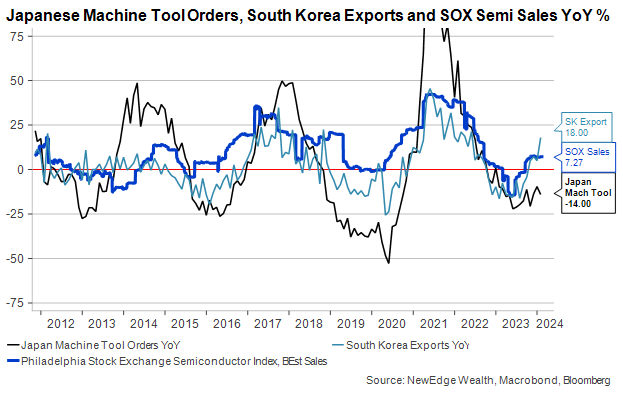
Aside: We also show Japanese Machine Tool Orders, as another correlated, cyclical data point, but note that this has been lagging in this current semi rebound. This is likely due to the “old economy” nature of machine tools, which can be advanced, semiconductor-laden automation equipment, but are often used in goods manufacturing processes, instead of the “new economy” areas like datacenters. All these cycles are interrelated, though, so we would eventually expect “old economy” activity to be dragged higher as well.
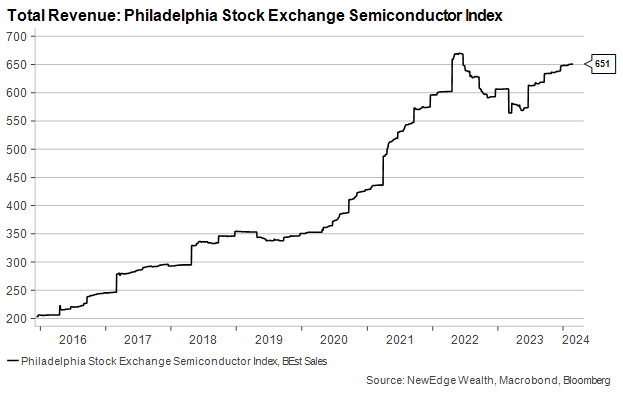
It is always important to remember when considering cyclicals that the stock prices will often run well ahead of the fundamentals. For example, semiconductor stocks peaked nearly 6 months before the sales growth peak in 2021 and bottomed nearly 8 months before the sales growth bottom in 2023. It will be important to remember this anticipatory price action when considering how to treat the next cyclical peak in semiconductor sales growth (the stocks may peak long before!).
Fortunately, the next peak in sales growth may be well in the future, with the sales growth recovery still nascent and overall sales being below the 2022 peak, even with the current AI-related surge.
“I felt you like electric light”: A Nascent Broader Cyclical Recovery
It is more than just semiconductors where we are starting to see signs of a nascent recovery in cyclical activity.
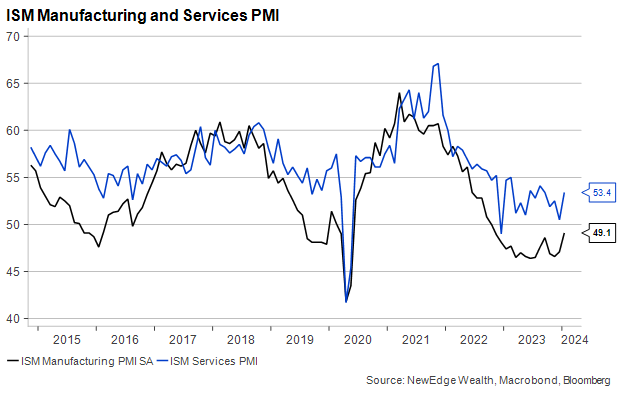
After 12 months of being in contraction (a sub-50 reading), the US Institute of Supply Management Manufacturing PMI looks to be bottoming out and beginning a recovery, while the ISM Services PMI looks to be accelerating.
This has important implications for markets and the Fed.
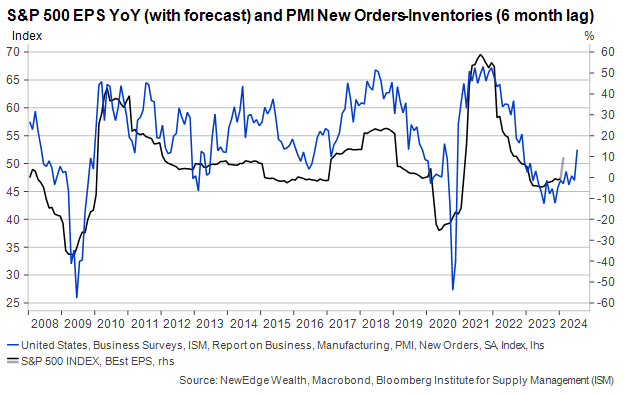
First on equities, accelerating PMIs (going from a low level to a higher level) are consistent with better EPS growth for the S&P 500.
Specific components of the PMI are even more insightful, with the spread between New Orders and Inventories typically leading S&P 500 EPS growth by about six months, as shown in the chart below. The recovery we are seeing in New Orders vs. Inventories is currently supportive of the Street consensus for a recovery in the S&P 500 growth rate in 2024, after a weak 2023 (consensus is for 10% growth in 2024).
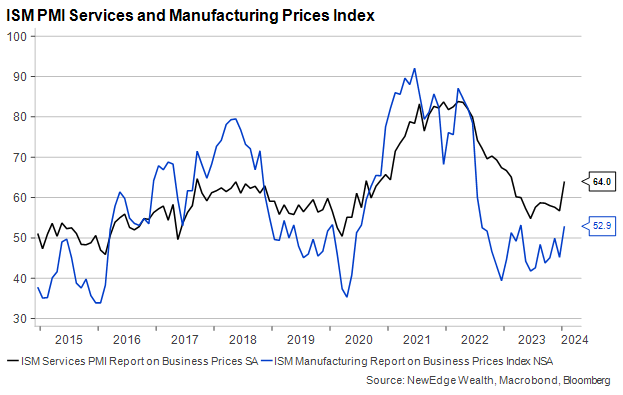
The biggest question and potential wrinkle with this nascent cyclical recovery is whether it will result in higher inflation. We are starting to see a rebound in the Prices index for both the Services and Manufacturing PMIs, which suggests that, after 18 months of disinflation, we could see price pressures renewed.
Of course, a resurgence in price pressures/inflation would not be welcome by the Fed, with even a stalling out of recent disinflation trends seen as problematic, which we discuss below.
“I spin on a whim, I slide to the right”: Fed Policy in an Accelerating Environment
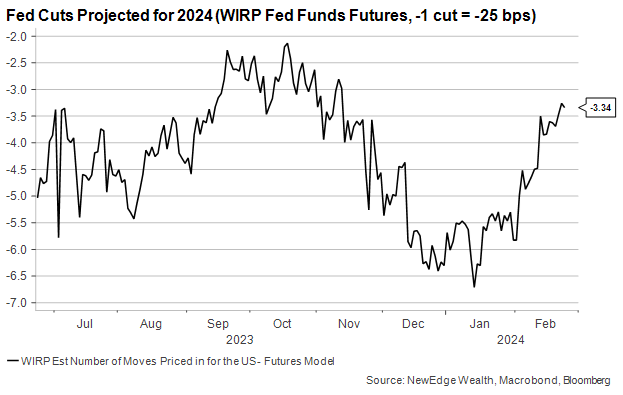
As we discussed two weeks ago and in our 2024 Outlook, we continue to push back on the bond market’s pricing of the path of Fed policy in 2024. We did not think the Fed would move to cut in March and thought that the 6+ cuts priced in for 2024 was not supported by the data or history.
The bond market is coming around to our view, with the 6.7 cuts priced in mid-January now just 3.3. We have also seen the beginning of these cuts “slide to the right”, with June now expected to be the first cut.
However, now that we are seeing further evidence of a recovery in cyclical data and challenges to the
disinflation narrative, we are wondering if this current pricing of the Fed, and the Fed’s own language will be pulled to be more hawkish.
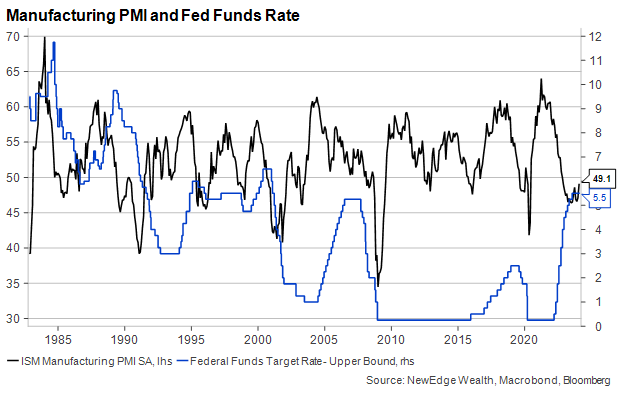
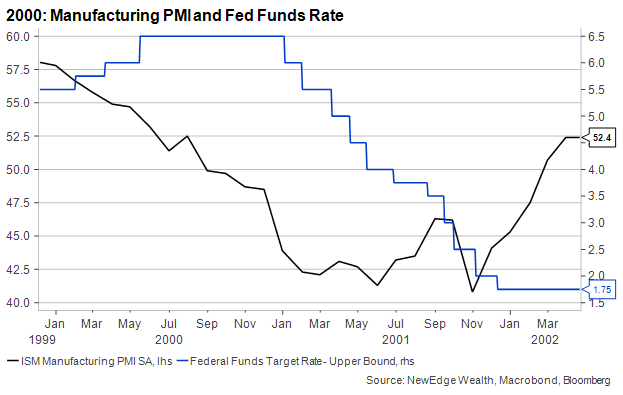
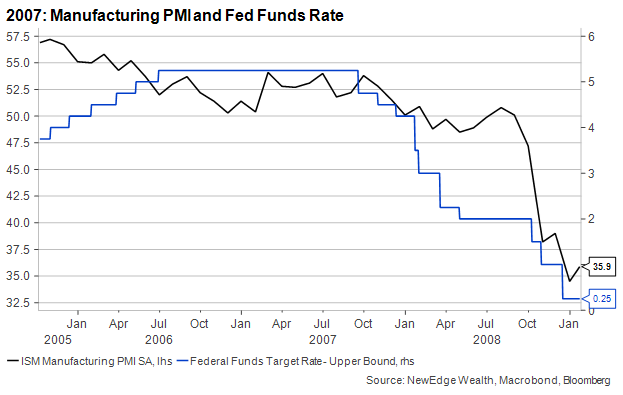
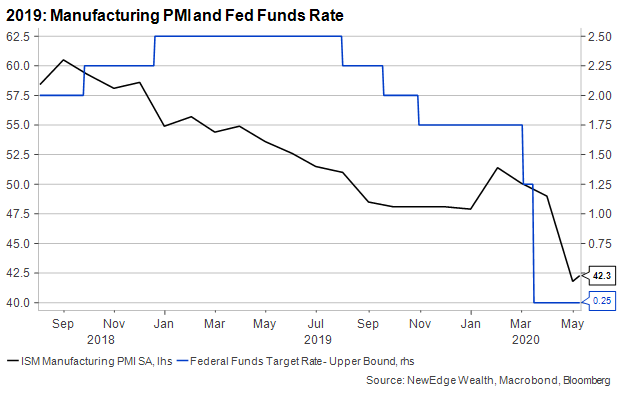
We repeat two assertions from our piece two weeks ago with additional data: first, there is little urgency for the Fed to act at this time; second, in the past 35 years the Fed has never began cutting in an accelerating PMI environment.
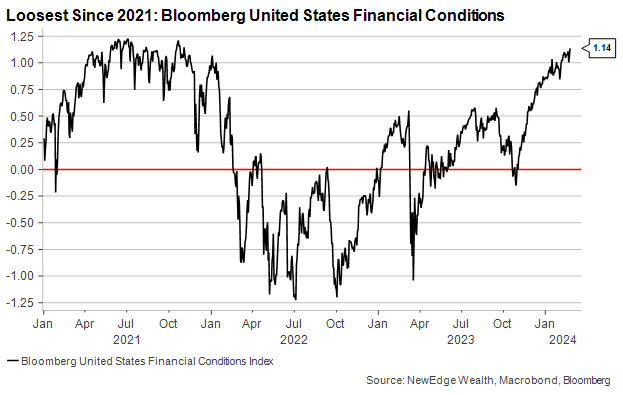
On the first point, we add the current state of financial conditions, which are now back to 2021 levels of easiness using the Bloomberg measure (which includes equity prices, credit spreads, yields, volatility, and more). Easy financial conditions are considered to be stimulative to/supportive of growth. At these easy levels, and with the potential for percolating price pressures, it is hard to see the Fed desiring an even greater loosening of financial conditions.
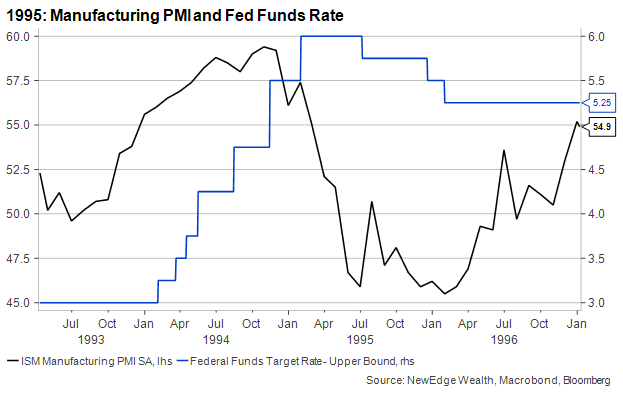
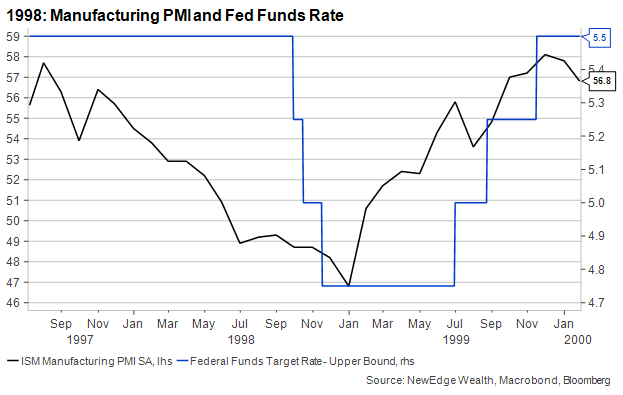
On the second point, the long dated chart below shows how, in the last 35 years, the Fed has never begun cutting rates in an accelerating PMI environment. Every time the Fed cut, even the non-recessionary cutting cycles of 1995, 1998, and 2019, PMIs were already decelerating when the Fed chose to cut. This is because in each and every cutting cycle over the last 35 years, there have been recession/growth-fears that contributed to the Fed’s decision to cut, even if the recession did not ultimately materialize.
In this “Strange Landing” cycle, we “never say never”, but it would certainly be unprecedented if the Fed moved to ease policy in, say, June if PMIs were continuing to rebound.
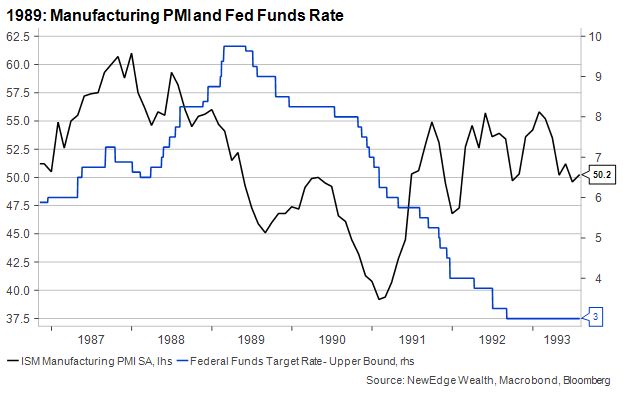
For those interested, we included the zoomed-in charts from each cutting cycle to see the PMI decline in detail.
“Breathe in, breathe out”: Market Impact Conclusion
Bringing this all together and how it will impact markets, there are a few important points.
For bonds, this backdrop of a cyclical recovery may keep upward pressure on bond yields for both the short and long end of the curve. The short end could be pressed higher by expectations for a tighter Fed, while the long-end could be pressed higher by less demand for flight-to-safety positioning and increased growth and inflation expectations (not to mention a large increase in coupon supply expected to continue this year). Higher yields may provide “another bit at the apple” for those investors who are looking to lock-in higher yields but can tolerate near term bond price volatility.
Both the 2- and 10-year Treasury yields are sitting at an important juncture, bumping right up against overhead resistance (the 100-day moving average for both). It could take a few attempts to “break through” this resistance before we see even higher yields. A failure to break above this resistance would raise questions about this cyclical growth recovery and the Fed’s path.
For equities, this backdrop of a cyclical recovery should be good for earnings. It supports the current estimates for a rebound in earnings growth and may (though we have seen no evidence of it yet) support a rebound in broader earnings revisions, which have continued to drift lower.
The question for equities going forward is if equity valuations will care about a tighter Fed and higher yields. For 1H23, equity markets did not care about a tighter Fed (valuations expanded as Fed policy expectations were revised higher/more hawkish), but in 3Q23 the Fed and higher rates put pressure on equity markets/valuations. In 4Q23, equity markets surged as an easy, pivot-party Fed was priced in, but as we have started 2024, equity markets have taken tighter Fed policy in incredible stride. There may come a “pain threshold” where equity markets suddenly care about the Fed and yields, mostly given the current 20.8x forward valuation (a valuation last seen in 2021 when the Fed was pumping markets full of liquidity).
So breathe in, breathe out and stay vigilant!
Bonus! PMI and Fed Funds Historical Charts
As mentioned above, here are the zoomed-in charts for each of the last Fed cutting cycles in the last 35 years, along with the ISM Manufacturing PMI.
You can see in each and every cycle, the Fed began cutting rates when PMIs were falling/decelerating. They may have continued to cut after a rebound in PMIs, but they never began cutting when PMIs were rebounding. This includes the celebrated 1995 cutting cycle (which was partially done to allay Fed officials’ recession fears), as well as the other non-recessionary cutting cycles of 1998 and 2019.
Top Points of the Week
By Austin Capasso and Ben Lope
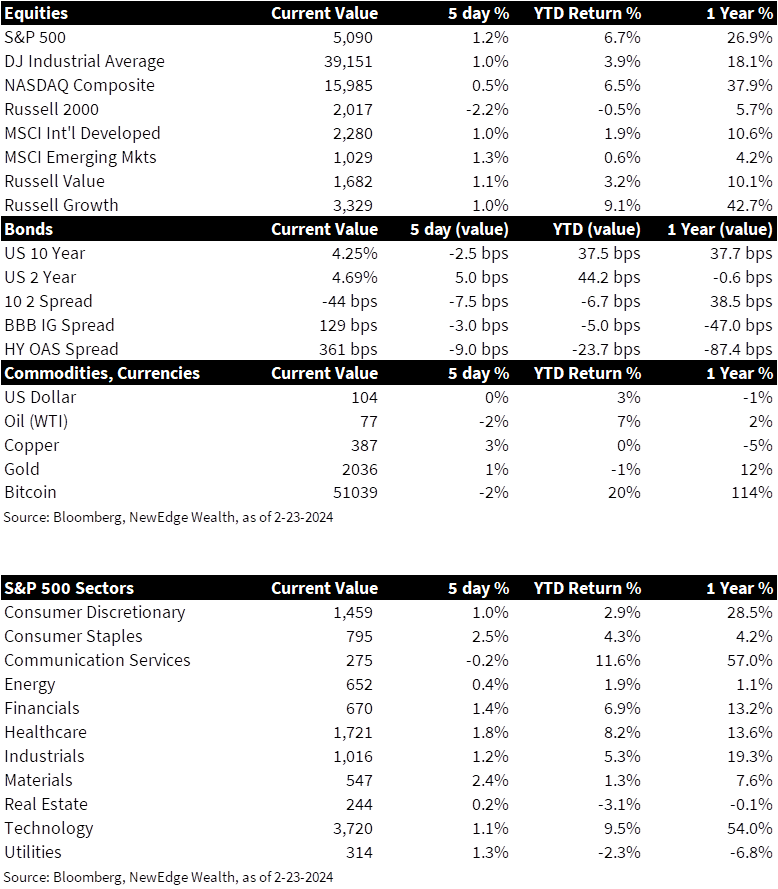
1. Equities Mostly Higher – US equities finished the week mostly higher, with large cap indices reversing midweek declines to end the week positive following the momentum created by NVDA’s earnings announcement. A notable laggard was the Russell 2000, down over 2% on the week. International equities posted modest gains, with both the MSCI Developed Markets and MSCI Emerging Markets indices up over 1%.
2. Yield Curve Inversion Increases – The yield curve became slightly more inverted on the week, as yields on 2 year Treasury bonds increased by approximately 5bps, while yields on 10 year Treasury bonds decreased by approximately 3bps.
3. Oil Prices Decrease Slightly – Oil prices declined modestly on the week, with Brent crude prices holding just above the $80/bbl. Commodity traders and analysts attributed the loss mostly to indications that the Federal Reserve will not begin cutting rates as early as futures markets indicated at the onset of the year.
4. Initial Jobless Claims Drop Near 200,000 – In a sign of continued labor market strength, the most recent Labor Department report on weekly jobless claims showed that initial claims fell 12,000 week-over-week to a level of 201,000. This is significantly lower than economists’ expectations of 218,000. Market observers have pointed to the strong labor market as a reason that the Fed appears to be in no rush to cut rates.
5. Fed Speak Summary – We saw an abundance of Fed Speak this week. The overarching takeaway was that the Fed will remain data dependent and hold off on making any interest rate decisions to prevent reigniting inflation as it continues its descent downward. Rate cuts have now been priced to just three for this year and Powell has openly said he is against a rate cut in March.
6. US PMI Shows Improvements in Manufacturing – The US manufacturing Purchaser’s Managers Index (PMI) rose to a 17-month high of 51.5 in February, which indicates expansionary territory. The U.S. services PMI dipped to a three-month low of 51.3 but is still in expansionary territory. The important takeaway here is that the US economy is still humming along despite the highest interest rates in more than two decades.
7. NVDA Earnings – AI momentum continued following NVDA detailing another huge beat during their earnings announcement after the bell on Wednesday. The stock is up over 15% in the two trading sessions that followed company officials detailing 500% YoY earnings growth, margins hitting record highs, and a 10% raise in Q1 2024 guidance.
8. China Attempts to Boost Property Market – China’s lenders cut the benchmark five-year loan prime rate for the first time since June 2023, which extends their efforts to revive the country’s weakening property market. The Chinese central bank kept its one-year loan prime rate, the peg for most household and corporate loans in China, unchanged. However, the five-year loan rate, the peg for most mortgages, was cut by 25 basis points to 3.95%, versus expectations of 15 basis points. It will be interesting if this move improves their economy.
9. Upcoming Earnings – We are close to the end of earnings season. Next week’s marquee earnings announcements are from eBay, Macy’s, and Salesforce.
10. The Week Ahead – Next week’s economic calendar includes figures for January New Home Sales on Monday, January Durable Goods and February Consumer Confidence on Tuesday, Q4 Real GDP on Wednesday, and February Manufacturing PMIs and Consumer Sentiment on Friday.
IMPORTANT DISCLOSURES
Abbreviations/Definitions: AI: artificial intelligence; CapEx: capital expenditures, money invested be a company to acquire or upgrade fixed, physical or nonconsumable assets; Fed speak: refers to speeches about monetary policy given by members of the U.S. Federal Reserve Bord of Governors; ISM Manufacturing PMI: Institute for Supply Management Purchasing Managers Index; ISM Services PMI: The Institute of Supply Management (ISM) services PMI (formerly known as Non-Manufacturing Index) is an economic index based on surveys of more than 400 non-manufacturing (or services) firms’ purchasing and supply executives; PMI: Purchasing Managers’ Index.
Index Information: All returns represent total return for stated period. S&P 500 is a total return index that reflects both changes in the prices of stocks in the S&P 500 Index as well as the reinvestment of the dividend income from its underlying stocks. Dow Jones Industrial Average (DJ Industrial Average) is a price-weighted average of 30 actively traded blue-chip stocks trading New York Stock Exchange and Nasdaq. The NASDAQ Composite Index measures all NASDAQ domestic and international based common type stocks listed on the Nasdaq Stock Market. Russell 2000 is an index that measures the performance of the small-cap segment of the U.S. equity universe. MSCI International Developed measures equity market performance of large, developed markets not including the U.S. MSCI Emerging Markets (MSCI Emerging Mkts) measures equity market performance of emerging markets. Russell 1000 Growth Index measures the performance of the large- cap growth segment of the US equity universe. It includes those Russell 1000 companies with relatively higher price-to-book ratios, higher I/B/E/S forecast medium term (2 year) growth and higher sales per share historical growth (5 years). The Russell 1000 Value Index measures the performance of the large cap value segment of the US equity universe. It includes those Russell 1000 companies with relatively lower price-to-book ratios, lower I/B/E/S forecast medium term (2 year) growth and lower sales per share historical growth (5 years). The BBB IG Spread is the Bloomberg Baa Corporate Index that measures the spread of BBB/Baa U.S. corporate bond yields over Treasuries. The HY OAS is the High Yield Option Adjusted Spread index measuring the spread of high yield bonds over Treasuries. The PHLX Semiconductor Sector Index (SOX) is a modified market capitalization-weighted index composed of companies primarily involved in the design, distribution, manufacture, and sale of semiconductors.
Sector Returns: Sectors are based on the GICS methodology. Returns are cumulative total return for stated period, including reinvestment of dividends.
The views and opinions included in these materials belong to their author and do not necessarily reflect the views and opinions of NewEdge Capital Group, LLC.
This information is general in nature and has been prepared solely for informational and educational purposes and does not constitute an offer or a recommendation to buy or sell any particular security or to adopt any specific investment strategy.
NewEdge and its affiliates do not render advice on legal, tax and/or tax accounting matters. You should consult your personal tax and/or legal advisor to learn about any potential tax or other implications that may result from acting on a particular recommendation.
The trademarks and service marks contained herein are the property of their respective owners. Unless otherwise specifically indicated, all information with respect to any third party not affiliated with NewEdge has been provided by, and is the sole responsibility of, such third party and has not been independently verified by NewEdge, its affiliates or any other independent third party. No representation is given with respect to its accuracy or completeness, and such information and opinions may change without notice.
Investing involves risk, including possible loss of principal. Past performance is no guarantee of future results.
Any forward-looking statements or forecasts are based on assumptions and actual results are expected to vary from any such statements or forecasts. No assurance can be given that investment objectives or target returns will be achieved. Future returns may be higher or lower than the estimates presented herein.
An investment cannot be made directly in an index. Indices are unmanaged and have no fees or expenses. You can obtain information about many indices online at a variety of sources including: https://www.sec.gov/answers/indices.htm.
All data is subject to change without notice.
© 2026 NewEdge Capital Group, LLC
