


Leave your stepping stones behind
There’s something that calls for you
Forget the debt you’ve left
That will not follow you
“It’s All Over Now Baby Blue”, Bob Dylan
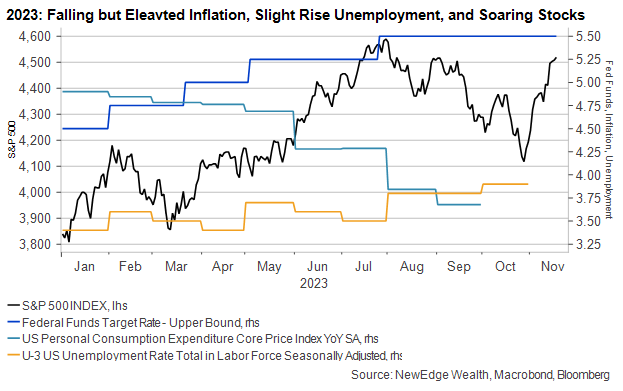
10 bps was enough to cause a spark.
This week, U.S. inflation data surprised to the downside by ~10 bps across metrics (both Headline and Core CPI month-over-month and year-over-year). This slightly softer-than-expected inflation print sparked a huge rally across asset classes, with both bonds and equites celebrating the apparent demise of our collective inflationary woes.
Part of this rally was driven by positioning: many of the areas that initially rallied the most were those that had been the most oversold and unloved (oversold referring to asset prices that move too far, too fast to the downside, setting them up for a potential rebound).
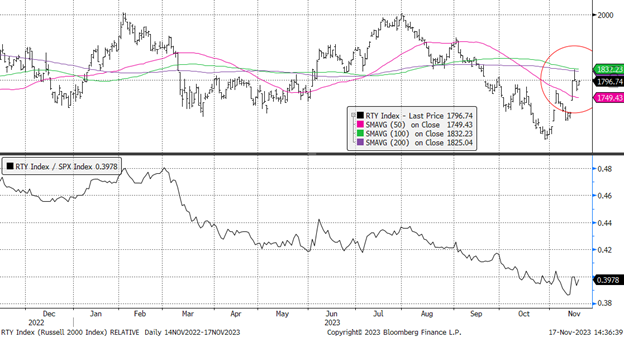
Laggard areas like Russell 2000 Small Caps, S&P High Beta, and cyclical sectors like Industrials and Materials initially rebounded with gusto, vastly outperforming the large cap, tech heavy indices that have led the equity market higher all year. Notably, this gusto and outperformance has been short lived in some areas, with rallies up to technical resistance levels followed by weakness (see the Russell 2000 below, rallying up to its 200-day and then struggling).
Russell 2000 Small Cap Index Absolute (top) and Relative to S&P 500 (bottom)
The other part of this rally was driven by bets that this softer inflation print cemented the end of the Fed’s rapid and substantial rate hiking cycle, and, importantly, opened the door for the beginning of easing in early 2024.
The expectation for the end of tightening and the beginning of easing boosted bond prices (yields fell), as further rate hikes were removed from Fed Funds Futures prices. Further, the futures and bond market also stepped up bets that the Fed would cut rates in 2024, with 100 bps (1%, or four 25 bps cuts) priced into 2024, starting as early as March.
This ~100 bps of cuts contrasts with the ~25 bps of cuts forecasted by the Fed in the September update of its Dot Plot (it will be very interesting to see how the 2024 and 2025 Dots change in the December update a few weeks away).
This is not the first time this hiking cycle that the bond market has priced in a far easier policy path than Fed forecasts or commentary suggested. In fact, Deutsche Bank has counted seven times this hiking cycle that the market priced in a pivot that never materialized. This is one key reason why there has been a floor under and upward bias to yields, as the bond market has continuously had to push out its expectations for easier policy further into the future.
But after this week’s softer CPI and sharp movement lower in bond yields, is this time different? Is it truly “all over now baby blue” for this tightening cycle?
A Different Kind of Cuts
Importantly, the expected cuts in 2024 are not being accompanied by dire forecasts for an imminent recession, which would normally be a key justification for the Fed to ease policy. Instead, these are considered “insurance” cuts, tweaking policy rates slightly lower in order to insure policy enables the economic expansion to continue.
Long live the “soft landing”.
This rationalization of tweaking policy comes from looking at real rates (a concept we wrote about over the summer, highlighting some of the challenges and ambiguity of using real rates as a driver of policy) and from looking at history.
There are three recent historical examples of the Fed tweaking policy rates lower when the U.S. economy was not already in or barreling towards a recession: 1995, 1998, and 2019.
The dynamic that is often forgotten, though, is that in each of these scenarios recession fears were heightened at the Fed, which saw itself taking action to prevent further economic weakness. Below we examine each of these cutting episodes.
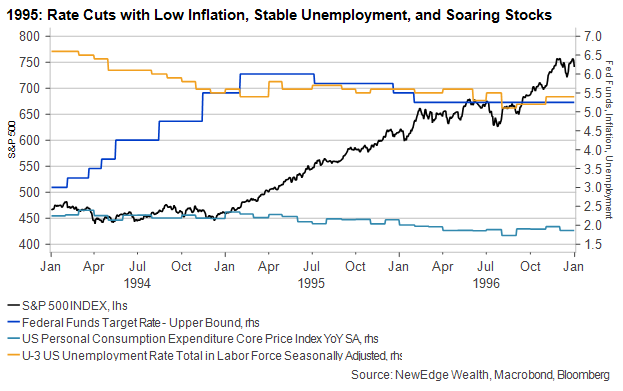
1995
In 1995, recession fears stemmed from bond market turmoil experienced during 1994’s rapid rate hiking cycle (rates went from 3.25% to 6% over the course of 12 months), which culminated in the December 1994 bankruptcy of Orange County and the Mexican currency crisis.
After economic growth had slowed at the beginning of 1995, along with a slight-but-temporary uptick in unemployment, Fed Chair Greenspan warned of “increased risk of a modest near-term recession,” signaling to markets that rate cuts were likely.
The Fed Chair did express comfort with the inflation level, which had been steadily falling. This gave the Fed room to cut rates by 75 bps over six months. Importantly, the Fed’s inflation mandate at the time was “price stability”, as it did not adopt the explicit 2% target until 2012.
Fascinatingly, as the Fed was cutting interest rates in the summer of 1995, the Dow was hitting new all-time highs, so clearly the equity market was not nearly as fearful of a recession as the Fed was! Where the Fed focused on a slight slowdown in past GDP growth, the equity market was focused on the building capex and productivity boom from the buildout of the Internet.
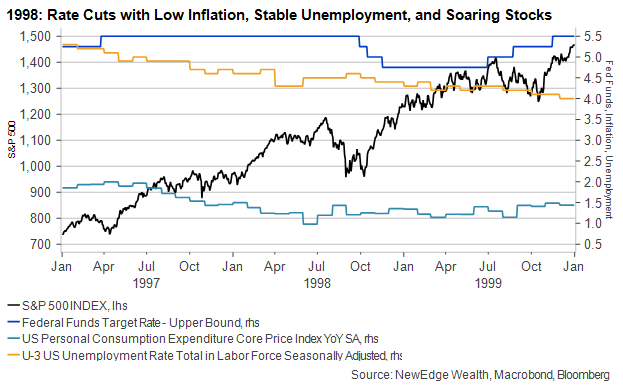
1998
In 1998, recession fears kicked up due to financial market turmoil domestically and abroad. The Asian currency crisis, which spread to Latin America as well, was compounded by the Russian currency crisis and debt default, and the failure of the hedge fund Long Term Capital Management, which threatened widespread counter party and contagion risk in financial markets.
In a speech a few weeks before the September 1998 rate cuts, Greenspan expressed, “it is just not credible that the United States can remain an oasis of prosperity unaffected by a world that is experiencing greatly increased stress.”
Inflation also gave the Fed room to cut, as it has been steadily declining in recent years, despite strong growth, thanks in part to a productivity boom and a continuous drop in unemployment.
Equity markets cheered the news of rate cuts, and by the time the third surprise rate cut was delivered in November of 1998, the NASDAQ was at a new all-time high. Just like 1995, the equity market did not share the same recession fears as the Fed.
The aftermath of this policy easing is that some consider it to have thrown lighter fluid on the tech-bubble (despite Greenspan’s 1996 warning of “irrational exuberance”), effectively adding liquidity and support to a market that did not need the speculative encouragement. The 150 bps of hikes in 1990 and 2000 did little to derail the Dot-Com bubble, just as the 425 bps of cuts in 2001 did not do much to stop the bleed as the bubble collapsed in on itself.
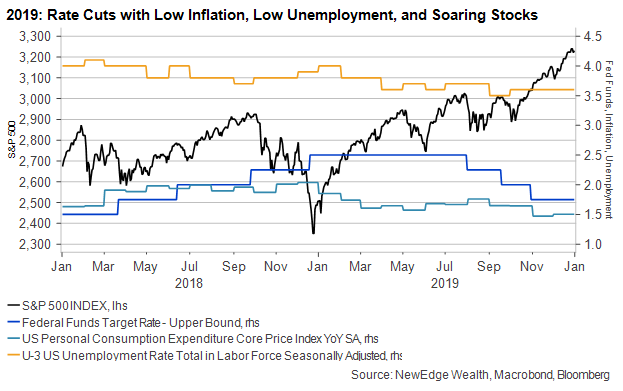
2019
Over the course of 2019, fears of recession were brewing at the Fed, as the year’s trade war and tariffs threatened to upend the stable economic expansion. Financial market turmoil in late 2018, had already caused the Fed to back off from its hawkish, “auto pilot” commentary about future tightening. But even as growth remained resilient, and unemployment remained near a 50-year low, the Fed chose to pursue a “mid-cycle” adjustment and lower rates three times in 2019.
Inflation was near-nonexistent at this time, remaining below the Fed’s 2% target on the Core PCE for all of 2019. This gave the Fed room to ease policy, and also guide to no further rate increases unless they were to see a “really significant move up in inflation” (little did they know that it was coming!).
The U.S. equity market had already begun pricing in this pivot to easing coming out of the December 2018 lows, and though it reacted negatively to the first cut in August 2019, by the time the third cut was delivered in November, major indices were at new all-time highs. Once again, the equity market was not as fearful about a recession as the Fed was.
The aftermath of this easing is nuanced in that it can be argued that this easing sparked the bubble in Growth and speculative stocks that reached a peak in late 2021. The Fed’s pivot from tightening caused real yields to plunge, allowing for long-duration (Growth, speculative tech, etc.) stock valuations to surge higher.
Similarities and Lessons
There are some important similarities in each of these three episodes of Fed easing and no recession.
The first similarity is that they all involved fears of recession but limited risk of recession, as confirmed by soaring equity markets. Contrast 1995, 1998, and 2019, where markets quickly made new all-time highs post cuts, to 2001, 2008, and 2020. In the latter cohort of years, rate cuts were not celebrated by markets, but instead seen as an insufficient salve for the current economic weakness and risk-off market environment.
The second similarly is that each episode had financial market turmoil as a key source of recession fears. This financial market turmoil never spread to the broader economy, as it did in 2001 and 2008. Interestingly, the financial market turmoil of 2022 and the regional banking crisis of 2023 were not enough to get the Fed to ease, let alone stop its hiking and tightening cycle.
The third similarity is that 1995, 1998, and 2019 all had subdued inflation risks. Inflation was stable, falling, or below target in each of these years, respectively, which gave the Fed freedom to ease policy. In today’s environment, the slightly-cooler October inflation data is encouraging, but Core CPI remains at 4%, well above the Fed’s target. Further progress on inflation is likely, but the Fed continues to be cautious about claiming victory on inflation too soon. We also expect the Fed to continue to be concerned about inflation’s return if they ease policy too soon and into a too-tight economy, such as the current state of being near full employment.
The last similarity is that none of these episodes had “high real rates” as the reason to ease policy (as it is being discussed today). The real Fed funds rate using Core PCE remained above 3% in 1995 and 1998, a level that was not seen as overly restrictive. Today’s real rate is 1.87%, up substantially from 2021’s eye-popping low of -5%, but still below where real rates were maintained in the 1990s and 2000s.
Conclusion
The Fed has a long history of pivoting quickly and doing an “about face” when data or events support a change in their policy stance (though they were arguably very late to change in 2022 after 2021’s transitory assertions).
Knowing that the Fed can change its mind means that we should also be open minded to a swift change in the policy path going forward. However, given the persistent inflation backdrop and the still-resilient economy, we wonder if the Fed will be as eager to make tweaks to policy rates in the very near term, mostly compared to the scenarios of 1995, 1998, and 2019.
Of course, if consumption and employment data were to weaken sharply, while inflation data continues to moderate, it is likely we would see a Fed response to ease policy, but what would this mean for growth expectations? Said another way, with 100 bps of cuts already priced in to bond markets (and arguably the equity market at 19x forward EPS for the S&P 500!), what would need to change in the backdrop for data for even more easing to be priced in?
We do learn from 1995, 1998, and 2019 that cuts with no recession risk are often “sniffed out” by the market, and celebrated with powerful risk asset returns. But we also learn from 2001, 2008, and 2020 that cuts with real recession risk are initially seen as confirmation of greater challenges to come.
So, before we break out the harmonica and guitar to start a Bob Dylan sing along, singing that tightening is “all over”, let’s watch the progression of the data in the coming months to see if it confirms the bond market’s easing expectations.
Top Points of the Week
By Austin Capasso and Ben Lope
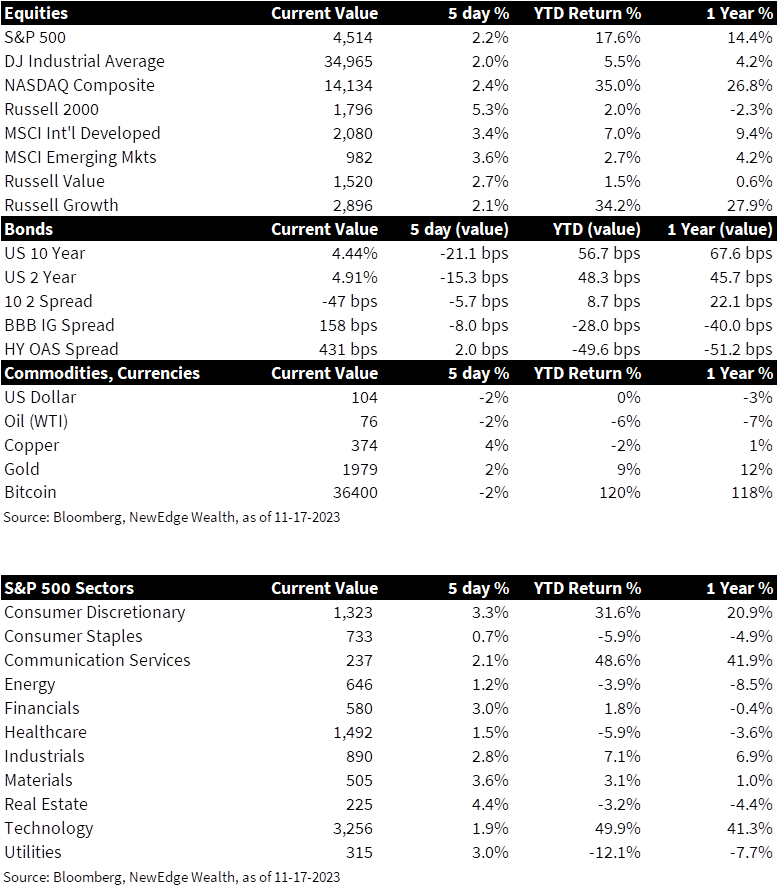
1. Equities rally – Global equities rallied on the week, powered by optimism from a softer than expected October CPI print. Within the US, small caps were the star, with the Russell 2000 index gaining over 5% on the week. Large cap indices notched a positive week as well, with the S&P 500, Dow Jones Industrial Average, and NASDAQ Composite each up over 2%. On the international front, the MSCI Developed and MSCI Emerging Markets indices were each up approximately 3.5%.
2. Rates in the US drop – Treasury yields dropped sharply across the curve on Tuesday after October CPI figures came in below expectations, ending the week 10-20bps lower than Monday’s levels. Yields on 2-year Treasury bonds fell approximately 10bps on the week, while yields on 10-year Treasury bonds fell by approximately 20bps, resulting in the 2-10 year yield curve becoming slightly more inverted.
3. Oil rallies to end the week – After briefly dipping below $80 on Thursday on news of a larger than expected increase in U.S. crude inventories, the price per barrel of Brent crude oil rallied on Friday to end the week about flat. Oil prices are off approximately 20% from their September highs, potentially pointing to concerns about global growth. However, the global oil market continues to tighten, with low inventories and demand exceeding supply around the world.
4. Summary Fed Speak this week – This week saw an abundance of Fed speakers that all gave similar messaging surrounding patience and gradualism. The Fed plan to wait and assess incoming economic data into the end of the year and adjust rates gradually given the current state of the economy. A rate hike is still not out of the question and will be dependent on economic data. Currently, the market is pricing in 100 basis points of cuts by the end of 2024 with a 40% probability those cuts start in March, and a much higher probability of 85% that those cuts start in May.
5. US retail sales were weak, but not as weak as people thought – US retail sales dropped -0.1% on the headline, which was higher than the expected -0.3% forecast. The more watched control group component of retail sales, which excludes auto and gas, increased +0.1% and was below the expected increase of +0.2%. This indicates that US consumers remain in better shape than originally expected. We will continue to monitor US consumer spending for any implications on the market.
6. October CPI & PPI showing deflation – Both the Consumer Price Index (CPI) and Producer Price Index (PPI) had dovish readings and keeps the deflationary narrative alive. Core CPI came in at 0.2%, which is a 2-year low and lower than the expected 0.3%. The supercore component of CPI, which is closely tracked by the Fed, dropped to 0.2% from 0.6% in September. The headline PPI saw its biggest monthly decline since April 2020 after dropping -0.5% versus the -0.1% expected. These numbers seem to be moving in the right direction. If this deflationary trend continues, it will force the Fed to consider rate cuts sooner rather than later.
7. Housing sentiment falls again – Housing sentiment for the month of November saw a drop on the NAHB/Wells Fargo Housing Market Index from 40 in October to 34 (also the expected reading for November). That marks the fourth consecutive month of declines on the report. Mortgage rates are near their highest levels in more than two decades and have evidently influenced home builder confidence.
8. Biden & Xi Summit – U.S.President Biden and Chinese President Xi Jinping met in San Francisco on Wednesday for their first face-to-face meeting in over a year. While relations between the two superpowers remain contentious, as signaled by Biden labeling Xi as a dictator during a press conference following the event, both sides laid the groundwork for potential breakthroughs regarding bilateral trade, tariffs, and military communications.
9. Moody’s downgrades outlook for US debt – Over the weekend Moody’s downgraded their outlook for U.S. sovereign debt, likely in anticipation of a looming government shutdown that was averted through Congressional negotiations during the week. Moody’s downgraded outlook is different than an official downgrade of their rating on U.S. sovereign debt but was viewed by many market observers as a precursor to the latter. If Moody’s were to eventually downgrade their rating on government debt from AAA to AA+, they would join the two other major rating agencies, Fitch and Standard & Poor’s, in doing so.
10. The week ahead – The week ahead headlines the November FOMC meeting where Jerome Powell and the Fed will discuss their current stance on policy. Consensus calls for a pause from the Fed to assess incoming economic data. We also get the Fed Dot Plot in that meeting, which will be closely watched by investors. For the remainder of the week, we will get a look into the US leading economic indicators, activity in the housing market, manufacturing & services PMI, and a look into durable goods activity and consumer sentiment.
IMPORTANT DISCLOSURES
Abbreviations/Definitions: Brent blend: a blend of crude oil extracted from oilfields in the North Sea between the United Kingdom and Norway. It is an industry standard because it is “light,” meaning not overly dense, and “sweet,” meaning it’s low in sulfur content; Core CPI: measures the changes in the price of goods and services, excluding food and energy; Core PCE: personal consumption expenditures prices excluding food and energy prices; CPI: Consumer Price Index; Dot Plot: The Fed dot plot is published quarterly as a chart showing where each of the 12 members of the FOMC expect the federal funds rate to be for each of the next three years and the long term; EPS: earnings per share; FOMC: Federal Open Market Committee; Headline CPI: the raw inflation figure reported through CPI that calculates the cost to purchase a fixed basket of goods to determine how much inflation is occurring in the broad economy; PPI: Producer Price Index; Supercore CPI: measures core services ex shelter.
Index Information: All returns represent total return for stated period. S&P 500 is a total return index that reflects both changes in the prices of stocks in the S&P 500 Index as well as the reinvestment of the dividend income from its underlying stocks. Dow Jones Industrial Average (DJ Industrial Average) is a price-weighted average of 30 actively traded blue-chip stocks trading New York Stock Exchange and Nasdaq. The NASDAQ Composite Index measures all NASDAQ domestic and international based common type stocks listed on the Nasdaq Stock Market. Russell 2000 is an index that measures the performance of the small-cap segment of the U.S. equity universe. MSCI International Developed measures equity market performance of large, developed markets not including the U.S. MSCI Emerging Markets (MSCI Emerging Mkts) measures equity market performance of emerging markets. Russell 1000 Growth Index measures the performance of the large- cap growth segment of the US equity universe. It includes those Russell 1000 companies with relatively higher price-to-book ratios, higher I/B/E/S forecast medium term (2 year) growth and higher sales per share historical growth (5 years). The Russell 1000 Value Index measures the performance of the large cap value segment of the US equity universe. It includes those Russell 1000 companies with relatively lower price-to-book ratios, lower I/B/E/S forecast medium term (2 year) growth and lower sales per share historical growth (5 years). The BBB IG Spread is the Bloomberg Baa Corporate Index that measures the spread of BBB/Baa U.S. corporate bond yields over Treasuries. The HY OAS is the High Yield Option Adjusted Spread index measuring the spread of high yield bonds over Treasuries.
Sector Returns: Sectors are based on the GICS methodology. Returns are cumulative total return for stated period, including reinvestment of dividends.
The views and opinions included in these materials belong to their author and do not necessarily reflect the views and opinions of NewEdge Capital Group, LLC.
This information is general in nature and has been prepared solely for informational and educational purposes and does not constitute an offer or a recommendation to buy or sell any particular security or to adopt any specific investment strategy.
NewEdge and its affiliates do not render advice on legal, tax and/or tax accounting matters. You should consult your personal tax and/or legal advisor to learn about any potential tax or other implications that may result from acting on a particular recommendation.
The trademarks and service marks contained herein are the property of their respective owners. Unless otherwise specifically indicated, all information with respect to any third party not affiliated with NewEdge has been provided by, and is the sole responsibility of, such third party and has not been independently verified by NewEdge, its affiliates or any other independent third party. No representation is given with respect to its accuracy or completeness, and such information and opinions may change without notice.
Investing involves risk, including possible loss of principal. Past performance is no guarantee of future results.
Any forward-looking statements or forecasts are based on assumptions and actual results are expected to vary from any such statements or forecasts. No assurance can be given that investment objectives or target returns will be achieved. Future returns may be higher or lower than the estimates presented herein.
An investment cannot be made directly in an index. Indices are unmanaged and have no fees or expenses. You can obtain information about many indices online at a variety of sources including: https://www.sec.gov/answers/indices.htm.
All data is subject to change without notice.
© 2026 NewEdge Capital Group, LLC

