


We’re not sure if Powell is a fan of The Stooges (he is a confirmed Dead Head), but he would do a great Fed-themed a rendition of the group’s 1969 tune I Wanna Be Your Dog, singing instead “And now I wanna be your dove!”
We’ve long thought that, at his core, Powell really wants to be a dove (a dove is a supporter of easy/loose monetary policy).
From the policy pivot in late 2018 to calm markets, to the cutting of interest rates in 2019 when unemployment was at a 50-year low, to the unprecedented extent of policy support conducted during the COVID shock, to maintaining aggressive easing post-COVID, despite signs of strong growth and high inflation, Powell has overseen a stretch of ultra-dovish policy actions.
This all seemed to change at last year’s Jackson Hole Symposium, the annual khaki-clad gathering of central bankers, when Powell delivered a curt speech intended to wake markets up to his born-again hawkishness. He warned of pain and sacrifice that would be necessary consequences of the Fed’s resolute fight against inflation. He committed the Fed to “keeping at it until the job is done”, meaning keeping rates in restrictive territory until elevated inflation was vanquished.
To start this year’s speech, Powell promised to deliver the same hawkish message as last year: inflation is still too high and that it is the Fed’s job to restore inflation back to their 2% target.
JP Morgan’s language model scored the speech as hawkish, but the least so in all of 2023, while the market interpreted the speech as near term hawkish, with higher two-year yields and the probability for a November rate hike climbing by 8% to 42%. But through this reiteration of hawkishness and the market’s reaction, Powell was far more balanced in his message compared to 2022.
Powell asserted that: “We see the current stance of policy as restrictive, putting downward pressure on economic activity, hiring, and inflation.” As we have written recently (here and here), it is hard to empirically argue that policy is resoundingly restrictive given the resilience of the U.S. growth and labor market, and the nascent rebound in activity in even some of the most interest-rate sensitive sectors of the economy, like housing (even some left-for-dead commercial office real estate stocks have been perking up since May!).
Powell used positive real rates, or nominal interest rates being higher than inflation, as evidence of this policy restrictiveness and potential reason to turn dovish and ease policy in 2024. It is true that real rates have moved significantly higher in the past year and are now positive, but some perspective is needed.
First, the reason why real rates have jumped so much in the past year is because they were coming off record-low levels (meaning in 2021 and early 2022, policy rates had never been so low when inflation was so high).
Second, compared to history, real rates using the Fed Funds rate and observed inflation (Core CPI) are barely positive and have only been positive for three months. Compare this to prior cycles, such as in the 1990s and 2000s when real rates were sustained at much higher levels for years before the economy eventually took a turn lower and the Fed responded by cutting rates.
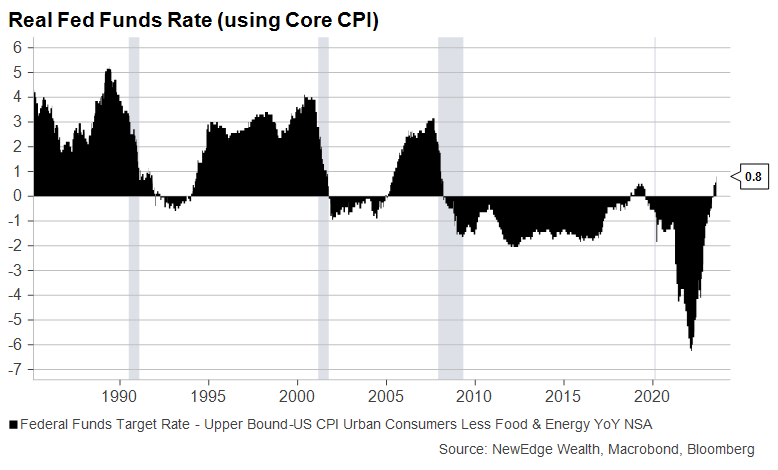
As of 8/25/23
The perspective of this little move into positive real rates territory makes the Fed’s recent discussion of cutting rates in 2024 thanks to “passive tightening”, or rising real rates as inflation falls, look eagerly dovish in the context of a history of much higher, sustained real rates.
Note: We include an important, be it wonky, bonus discussion below about how clarity is needed about how the Fed is calculating real interest rates, using observed or implied inflation.
Powell and the rest of the Fed are currently forecasting ~100 bps of rate cuts in 2024, while the bond market is pricing in ~100 bps of cuts next year as well. When asked about this forecast in July, Powell flashed his latent dove feathers, saying that the passive tightening dynamic, rising real rates as inflation falls, could drive the Fed to cut rates in 2024, even if inflation was above their 2% goal.
Of course, Powell may not get data that allows him to set his dove wings free. It remains to be seen if the tight labor market, continued hot wage growth, and economic growth running above trend will result in a reacceleration in inflation. If we do see an inflation reacceleration, hopes of cutting rates in 2024 with the backdrop of a resilient economy will be dashed (note this soft-landing outcome of continued strong growth and an easier Fed may be what was priced into equity markets at the end of July when the S&P 500 traded at 19x 2024’s $243 EPS, +12% YoY; a high, policy-supported valuation on top of strong earnings growth).
Conversely, the Fed could find itself cutting rates in 2024 if the economy and labor market were to weaken materially, but even the most dovish dove wouldn’t hope for that reason to ease policy.
Overall, this week’s Jackson Hole speech did little to change our view of a higher for longer Fed, despite some of Powell’s urges to let his deep dovishness peek out. If the economy remains resilient with a soft landing, real rates have not been that high for that long compared to history to suggest swift cuts. If the economy falters, also known as a hard landing, Powell can fully drop the hawk shroud and be the dove we all know and love.
For the bond market, the higher for longer Fed could keep a floor under short term interest rates, likely until economic weakness is pernicious enough to solidify an imminent Fed easing. For long interest rates, eventual economic weakness would likely be needed to drive significantly lower yields, while continued resiliency in growth, along with supply and demand factors, could keep an upward bias to yields. A resilient economy can keep credit spreads contained, though a recent rise in credit delinquencies should be watched closely as it runs counter to the “everything is fine” narrative about the U.S. economy.
For the equity market, pricing of the Fed’s policy path has been an irrelevant input in 2023, raising the question as to whether a further reiteration of higher for longer (possibly more rate hikes and/or a later start to cuts) will have an impact on equity valuations. Regardless, we continue to think that valuations as the sole driver of equity returns may have reached its apex in July, when the S&P traded to 20x and the NASDAQ traded to 33x next twelve months earnings. This puts the onus on earnings growth and earnings revisions to drive further upside, but note that even with much better economic growth than expected in 2023, earnings estimates have remained fairly static (possibly creating a low bar for further upside surprises).
And so, The Stooges may be a bit too proto-punk raw for Powell’s liking, but we can still hear him singing “I wanna be your dove!”, though the data may not give him a chance anytime soon.
Important Wonky Aside: How Do We Define Real?
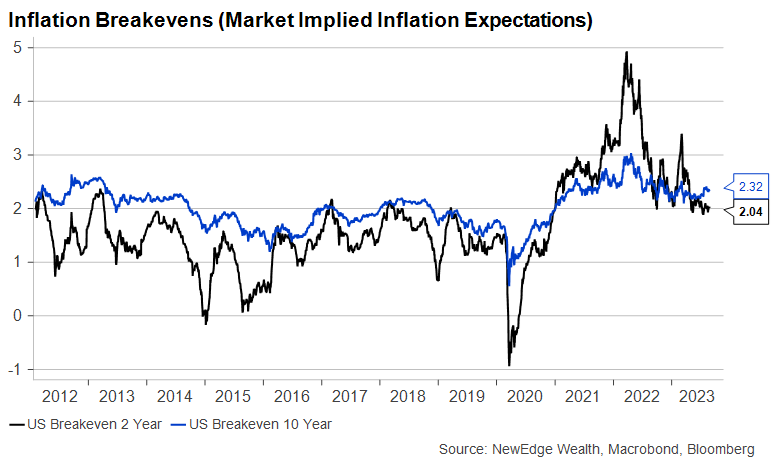
For fellow policy and rates nerds, there is an important discussion needed about what measure of inflation should be used to calculate real rates (real rates are nominal rates minus inflation). Should we use observed inflation, as shown above with the Core CPI, or should we use market implied inflation expectations through inflation breakevens?
Both have their limitations: observed inflation is backward looking, while market implied inflation is rarely accurate and based on thinly traded markets that can be overly volatile. A third measure of inflation could be used, consumer survey based inflation expectations, such as from the University of Michigan, but these measures are considered even more challenged in their methodology and predictiveness of future inflation.
The Fed has not expressly defined what inflation measure it uses in judging the level of real rates (though in the Jackson Hole speech it appeared Powell was using inflation breakevens for real rate calculations, but also cited observed inflation, adding to confusion). However, the path forward for each of these inflation measures could be different, resulting in conflicting measures of real interest rates and their degree of restrictiveness.
Real interest rates using inflation breakevens are higher today (+1.92%) than real interest rates using observed inflation (+0.8%) because inflation breakevens for both the short and long term are already pricing in a return to ~2% inflation and are near their pre-pandemic ranges (implying that the bond market always believed the Fed would be successful in return inflation back to 2%).
This means that if observed inflation moderates back toward 2%, this inflation moderation is already largely priced into inflation breakevens. Thus, real rates using breakevens would not rise significantly on their own as observed inflation fell, because breakevens don’t have as much room to normalize lower.
Given this automatic rise in real rates as the inflation falls, or passive tightening, has been discussed frequently by Powell as a reason to cut rates next year, knowing which definition of real rates and inflation are being used will be important in judging their next policy action.
If we could ask Powell one question, it would be which version of real rates they will use to judge policy restrictiveness and the potential for cuts next year.
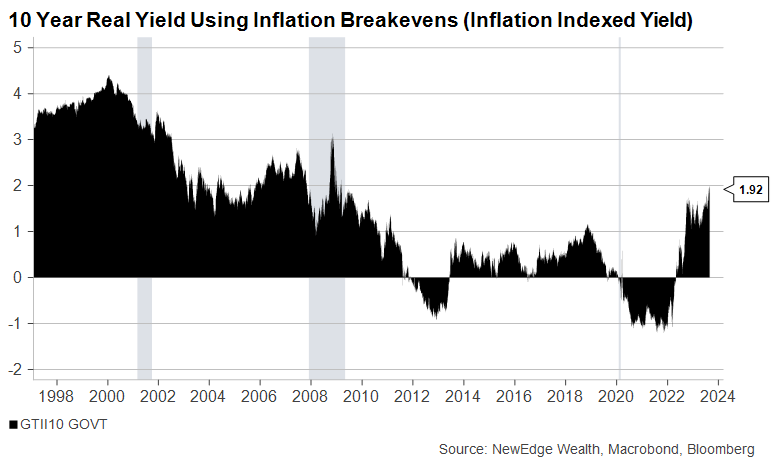
As of 8/25/23
As of 8/25/23
Top Points of the Week
By Austin Capasso and Connor Finnigan
1. Jerome Powell Speech at Jackson Hole – Earlier today, Jerome Powell gave a speech at the Jackson Hole Symposium on the current state of Fed policy. The speech was hawkish and left the Fed with maximum optionality on next steps. Powell addressed that inflation was still too high and the labor market is still too tight. He ended his speech by saying that the Fed will proceed carefully on their decision to further tighten or pause while they await more data.
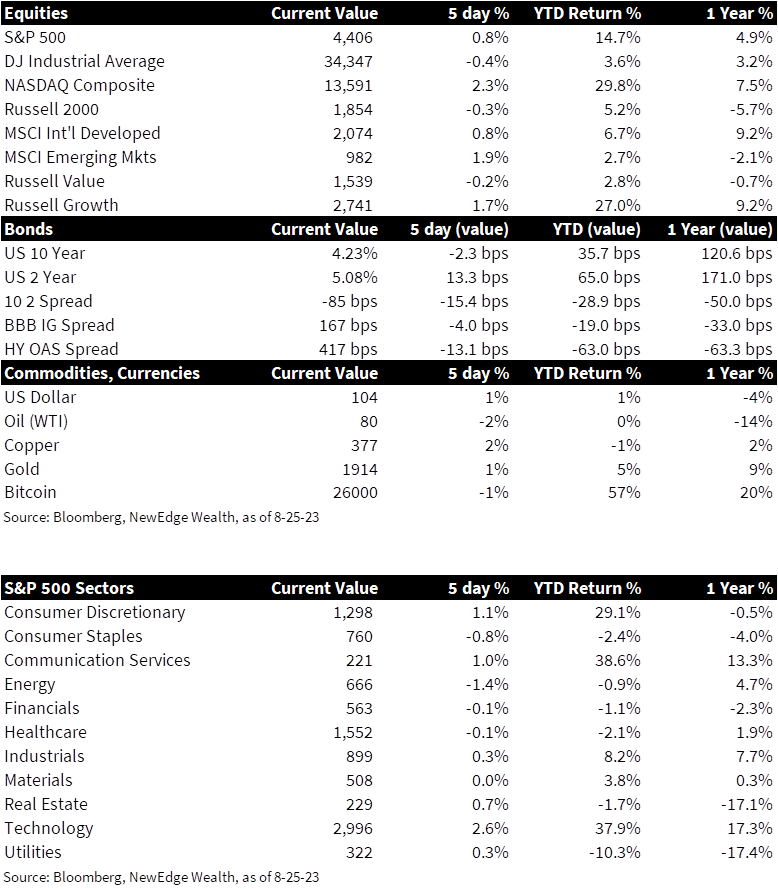
2. Largest Weekly Outflow in Two Months for US Equity Funds – US equity funds saw roughly a net $11.07 billion worth of outflows this past week, the largest outflow since June 21. Many investors wanted to reduce their exposure to riskier assets ahead of Powell’s speech at Jackson Hole. Additionally, there was a surge in yields which triggered caution about a potential selloff of mega-cap growth stocks.
3. US 10-year Treasury Hits Sixteen-Year High – On Monday, the US 10-year treasury climbed up four basis points to 4.241% hitting a sixteen-year high. The 30-year only rose 2 basis points to 4.304%. Yields rose slightly at the shorter end of the curve. This recent increase in the 10-year can be attributed to the resilience within the US economy and the likelihood of inflation staying higher for longer, which will force central banks to keep rates higher for longer.
4. Commodity ETFs Starting to See Inflows – In the past two months, 20 of the world’s largest broad based commodity ETFs attracted cash inflows. This is the first time this has happened in back-to-back months since early 2022 (according to Bloomberg). Recently, market inflows have been light, adding up to nearly net $1 billion, although to show the other side of this, the same 20 funds have lost a net $8 billion over the preceding five quarters.
5. US Jobless Claims Came in Lower than Expected – Continuing the trend of resilience and a healthy economy, US jobless claims decreased by 10,000 to a seasonally adjusted 230,000. This marks the third week in a row that jobless claims have decreased and an indication that the labor market continues to remain tight (meaning job openings are plentiful and available workers are scarce). Continuing claims remain low by historical standards at 1.702 million, meaning that workers are experiencing short spells of unemployment.
6. Weak Data from Germany Puts Pressure on the Euro – Although the largest economy in Europe, Germany, avoided a technical recession in Q2, the nation suffered the steepest decline in business activity in more than three years this month when its PMI entered into contractionary territory. PMI readings of 44.7 in August and 48.5 in July marked the lowest levels since May 2020. This recent news is putting downward pressure on the Euro given the lurking fears of stagflation in the German economy.
7. Durable Goods Sink 5.2% for July – Durable goods orders sank 5.2%, which is an area where a lot of the disinflation has stemmed from. This decrease is entirely attributed to automobiles and planes. Notably, if volatile automobiles and planes are taken out of the equation, durable goods would be up 0.5% on the month. That increase would mark the third consecutive month that durable goods would be up without the ups and downs at Boeing (aircraft designer/manufacturer).
8. Australian LNG Workers Threaten to Strike – While Woodside Energy on Thursday reached an in-principle agreement with unions at Australia’s largest liquified natural gas (LNG) project, unions at Chevron’s LNG facilities in Australia threatened a potential strike for better wages and working conditions. Woodside Energy and Chevron operations supply about 10% of global LNG output. The action could have sizeable implications to the energy supply chain given the strike plays out.
9. Earnings Update: NVDA Earnings Report Highlights, Broadcom Next Week – The name everyone had their eyes on this week, Nvidia (NVDA), reported Q2 2023 earnings after the close yesterday. The company beat on both the top and bottom with revenue coming in at $13.51 billion (a 101% jump from last year) and up a whopping 220% year-to-date. Despite its huge earnings day, NVDA seems to be trading sideways, which would indicate that we are in a period of digestion in markets as valuations have become exceedingly high without much sales growth to justify their prices. Another semi-conductor name, Broadcom, is the marquee name reporting earnings next week.
10. Big Week of Data on the Way – The upcoming week is one filled with important data for both the Fed and markets. We get consumer confidence, ADP report, insight into retail (an area that has been struggling as of late), PCE, Personal spending and income, and most importantly US nonfarm payrolls and employment rate.
IMPORTANT DISCLOSURES
Abbreviations/Definitions: ADP National Employment Report: a monthly report of economic data that tracks the level of nonfarm private employment in the U.S.; Consumer Confidence Survey: measures the level of consumer confidence in economic activity; Core CPI: measures the changes in the price of goods and services, excluding food and energy; EPS: earnings per share; LNG: liquified natural gas; Nonfarm Payrolls: the measure of the number of workers in the U.S. excluding farm workers and workers in a handful of other job classifications. The nonfarm payrolls classification excludes farm workers as well as some government workers, private households, proprietors, and non-profit employees; PCE: personal consumption expenditures; Powell: Jerome Powell, Chair of the Board of Governors of the Federal Reserve System; PMI: Purchasing Managers’ Index; Real rates: nominal rates minus inflation.
Index Information: All returns represent total return for stated period. S&P 500 is a total return index that reflects both changes in the prices of stocks in the S&P 500 Index as well as the reinvestment of the dividend income from its underlying stocks. Dow Jones Industrial Average (DJ Industrial Average) is a price-weighted average of 30 actively traded blue-chip stocks trading New York Stock Exchange and Nasdaq. The NASDAQ Composite Index measures all NASDAQ domestic and international based common type stocks listed on the Nasdaq Stock Market. Russell 2000 is an index that measures the performance of the small-cap segment of the U.S. equity universe. MSCI International Developed measures equity market performance of large, developed markets not including the U.S. MSCI Emerging Markets (MSCI Emerging Mkts) measures equity market performance of emerging markets. Russell 1000 Growth Index measures the performance of the large- cap growth segment of the US equity universe. It includes those Russell 1000 companies with relatively higher price-to-book ratios, higher I/B/E/S forecast medium term (2 year) growth and higher sales per share historical growth (5 years). The Russell 1000 Value Index measures the performance of the large cap value segment of the US equity universe. It includes those Russell 1000 companies with relatively lower price-to-book ratios, lower I/B/E/S forecast medium term (2 year) growth and lower sales per share historical growth (5 years). The BBB IG Spread is the Bloomberg Baa Corporate Index that measures the spread of BBB/Baa U.S. corporate bond yields over Treasuries. The HY OAS is the High Yield Option Adjusted Spread index measuring the spread of high yield bonds over Treasuries.
Sector Returns: Sectors are based on the GICS methodology. Returns are cumulative total return for stated period, including reinvestment of dividends.
The views and opinions included in these materials belong to their author and do not necessarily reflect the views and opinions of NewEdge Capital Group, LLC.
This information is general in nature and has been prepared solely for informational and educational purposes and does not constitute an offer or a recommendation to buy or sell any particular security or to adopt any specific investment strategy.
NewEdge and its affiliates do not render advice on legal, tax and/or tax accounting matters. You should consult your personal tax and/or legal advisor to learn about any potential tax or other implications that may result from acting on a particular recommendation.
The trademarks and service marks contained herein are the property of their respective owners. Unless otherwise specifically indicated, all information with respect to any third party not affiliated with NewEdge has been provided by, and is the sole responsibility of, such third party and has not been independently verified by NewEdge, its affiliates or any other independent third party. No representation is given with respect to its accuracy or completeness, and such information and opinions may change without notice.
Investing involves risk, including possible loss of principal. Past performance is no guarantee of future results.
Any forward-looking statements or forecasts are based on assumptions and actual results are expected to vary from any such statements or forecasts. No assurance can be given that investment objectives or target returns will be achieved. Future returns may be higher or lower than the estimates presented herein.
An investment cannot be made directly in an index. Indices are unmanaged and have no fees or expenses. You can obtain information about many indices online at a variety of sources including: https://www.sec.gov/answers/indices.htm.
All data is subject to change without notice.
© 2026 NewEdge Capital Group, LLC

