
Where do we go from here?
The words are coming out all weird
“The Bends”- Radiohead
The bends, or decompression sickness (and the greatest Radiohead album), is a condition that threatens underwater divers if they move too quickly up to the surface. It is caused by a rapid change in pressure, resulting in bubbles of nitrogen being released from the blood, causing circulation issues and severe pain. One way to avoid the bends is to ascend from a dive carefully, following the timing of dive tables so as not to climb too rapidly.
In a way, shallow corrections are a way for the equity market to avoid getting the bends. Like a diver, if an equity market moves too far, too fast to the upside, in a melt-up, positioning chase or bubble, severe pain, meaning a deeper correction, can occur on the other side.
- Note there are times that moving too far, too fast is a good sign for forward equity market returns, occurring in the early days of a new bull markets as buyers rush in to get exposure to an improving equity outlook (RenMac’s Jeff DeGraff calls it “momentous momentum”).
Shallow corrections keep sentiment in check, preventing ebullience from turning into blind euphoria, and can shake out “weak hands” in terms of positioning.
After a roaring rally from mid-March until late July, U.S. equity markets have entered a correction phase. So far, the correction has been shallow and healthy, not exhibiting signs of the bends, or a sharp correction after a powerful rally. We look to an important level ~4,300 for the S&P 500 support (-6% from the July peak, with ~4,300 being the low from the June 2023 mild correction and the high from August 202) to maintain this “shallow and healthy” characteristic.
S&P 500

There are pockets of the market that are likely experiencing a case of the bends, having shot up meteorically since March and now are experiencing deeper corrections.
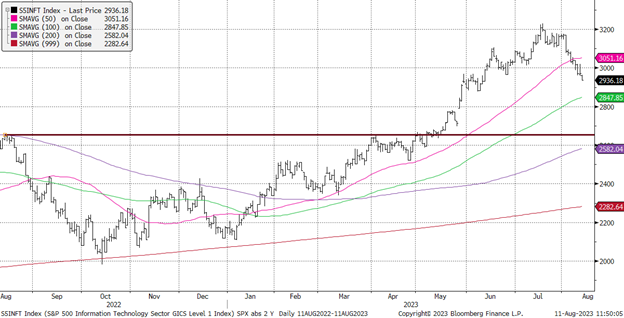
The U.S. large cap Technology sector falls into this bends category, after rallying 38% from its mid-March lows, it has had more room to fall back to support, already down ~10% from its mid-July peak (note that Tech stocks peaked prior to the broader market, an early sign of fading momentum in this dominant market leadership).
S&P 500 Technology Sector
We can also observe the bends, deeper corrections after powerful rallies, in some of the lower quality, more speculative, and higher risk/higher beta parts of the equity market. For example, ARKK Innovation rallied 45% since the beginning of May and has swiftly fallen 16% in the past two weeks.
The Source of the Bends
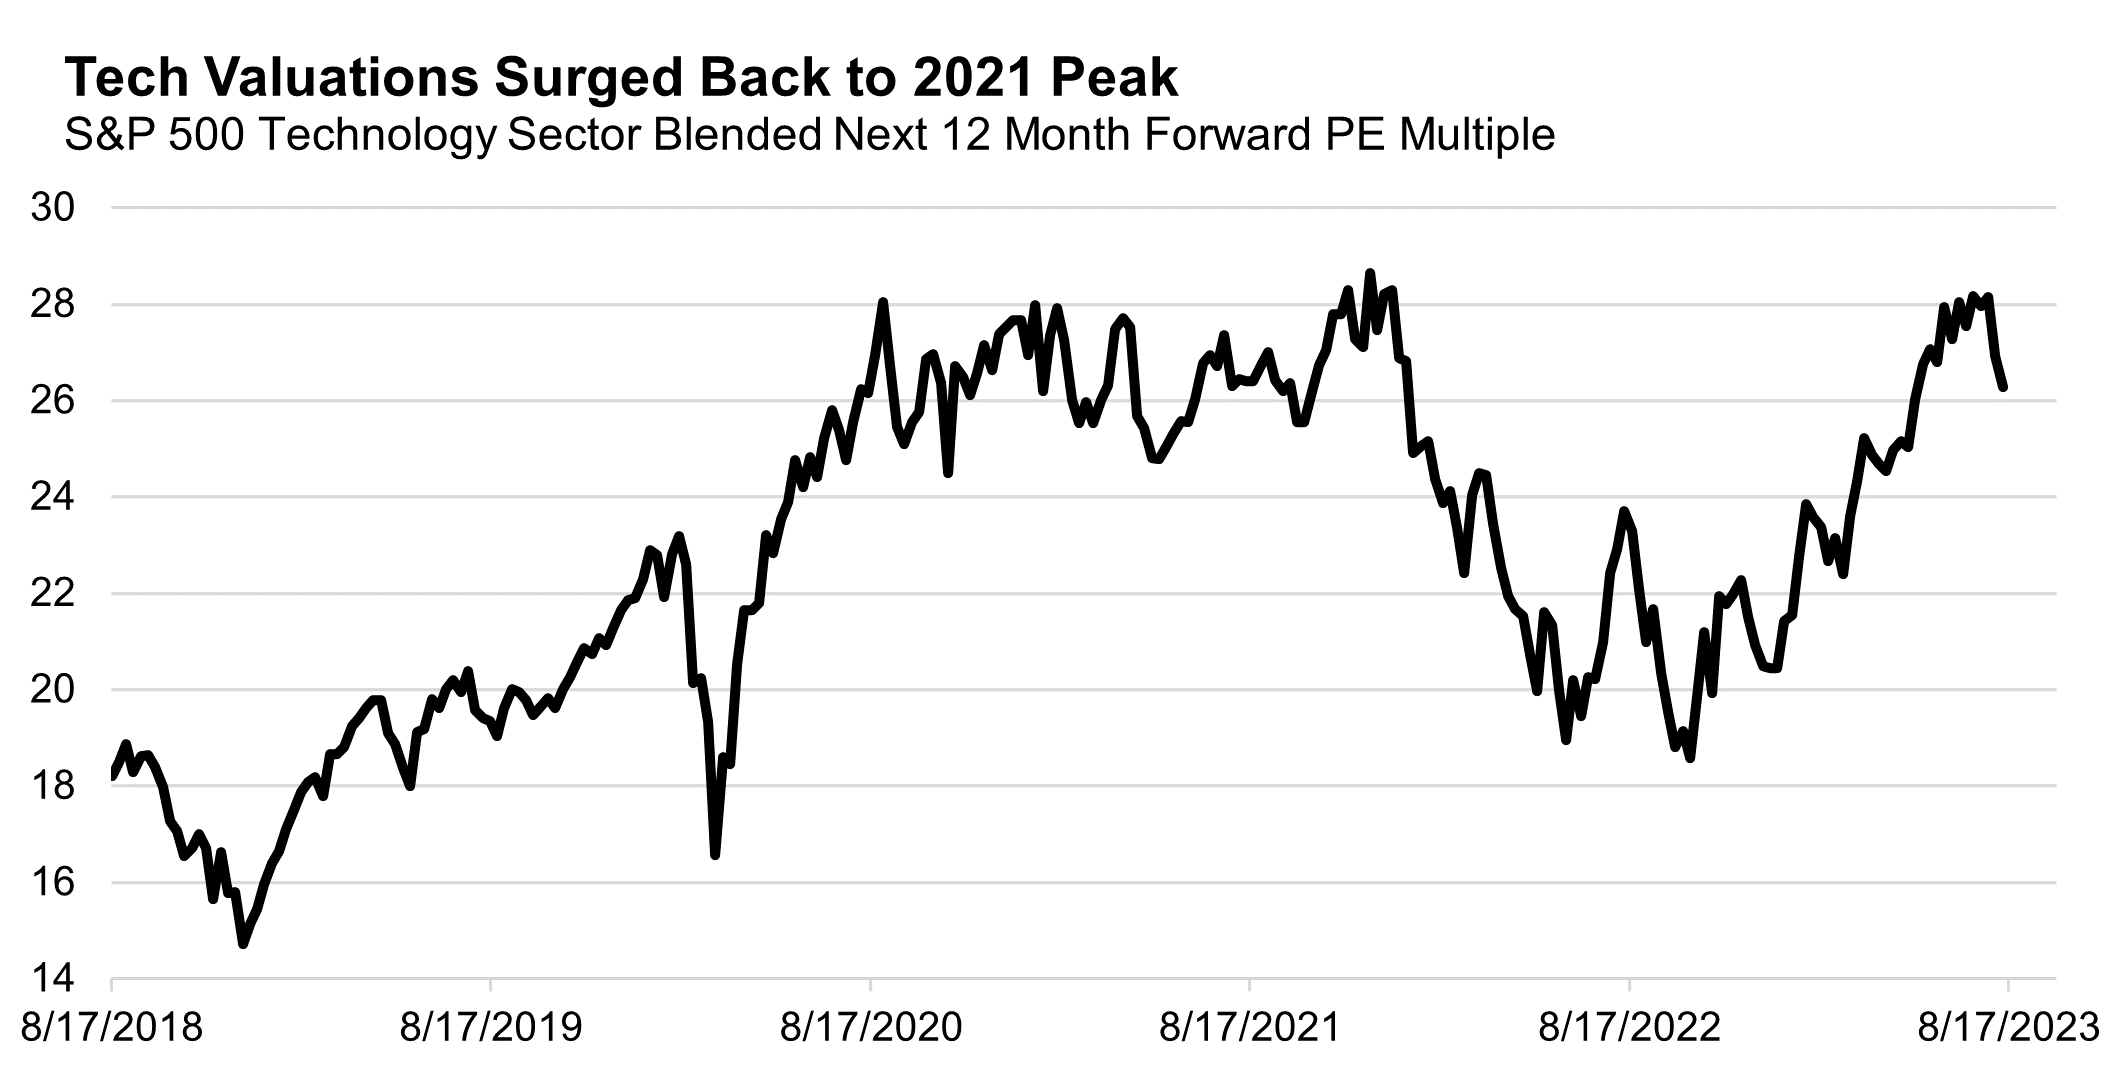
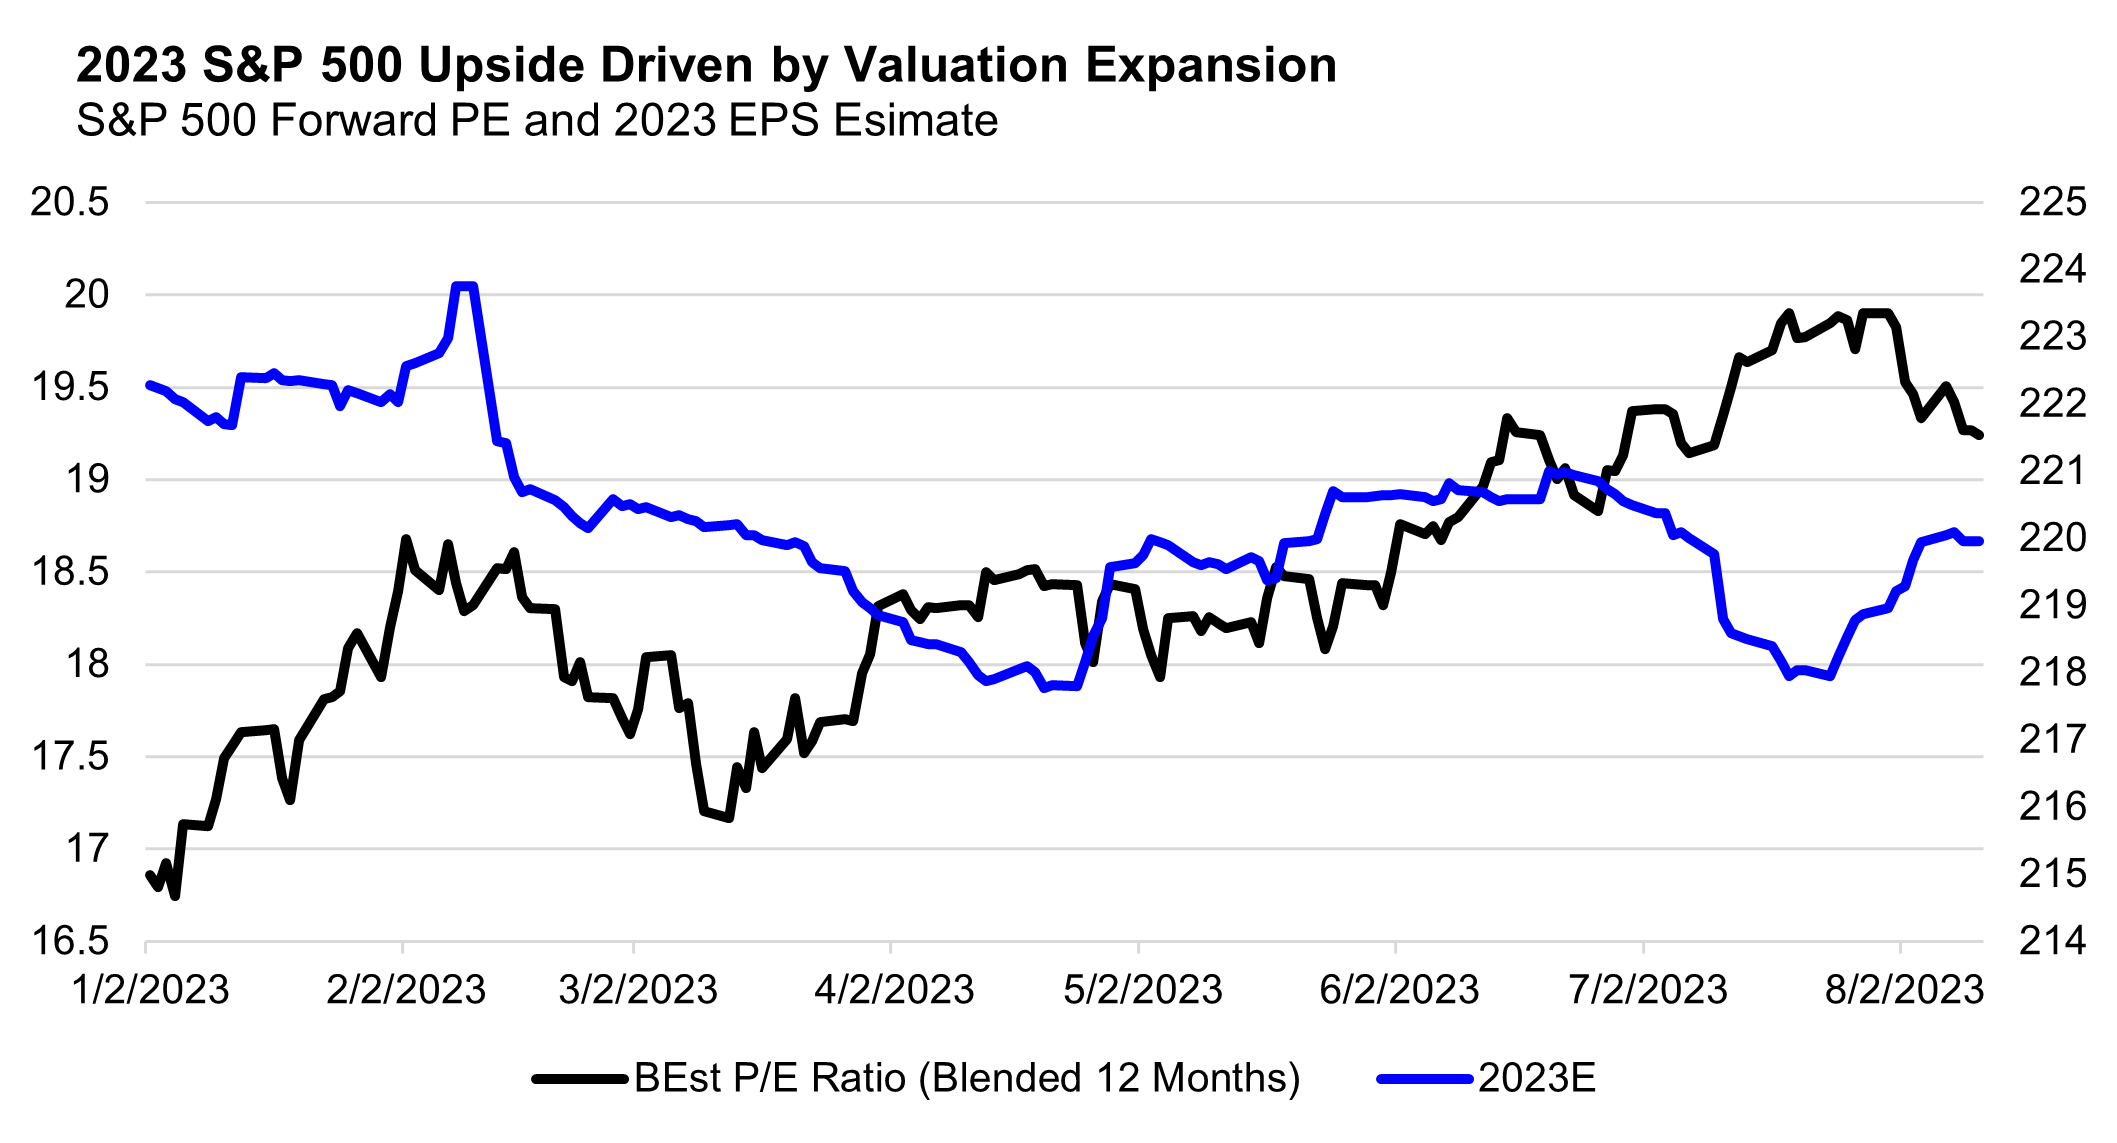
An important dynamic in this correction is that it is being entirely driven by valuation compression, the opposite of what drove the late 2022-2023 rally, which was almost entirely valuation expansion. From October 2022 to July 2023, the S&P 500’s forward PE multiple rose 30%, while the Technology sector’s forward PE surged 52%.
The Technology PE is particularly eye popping, having reached 28x forward in late July, which brought it back to its 2021 peak, an incredibly different interest rate and monetary policy environment. In late 2021, real interest rates were an ultra-accommodative -1.2% compared to today’s +1.7% for the 10 year. In the past, tech valuations and real interest rates have been closely related, however this relationship broke down completely in 1H23. Eventually we think yields will matter for equity valuations, but this recoupling process can take time.
Even the broad S&P 500 reached fairly rarified air from a valuation perspective in late July, touching 20x forward earnings, a level that has only been eclipsed two other times in the past 30 years: the 1990’s tech bubble and the 2020-2021 COVID policy-fueled bubble.
Returning to the source of both the rally and the correction, we can observe it being valuation driven by tracking earnings estimates for the S&P 500 and its sectors.
Throughout this year, earnings estimates have been stagnant, not being cut or raised materially for 2023, 2024, or 2025.
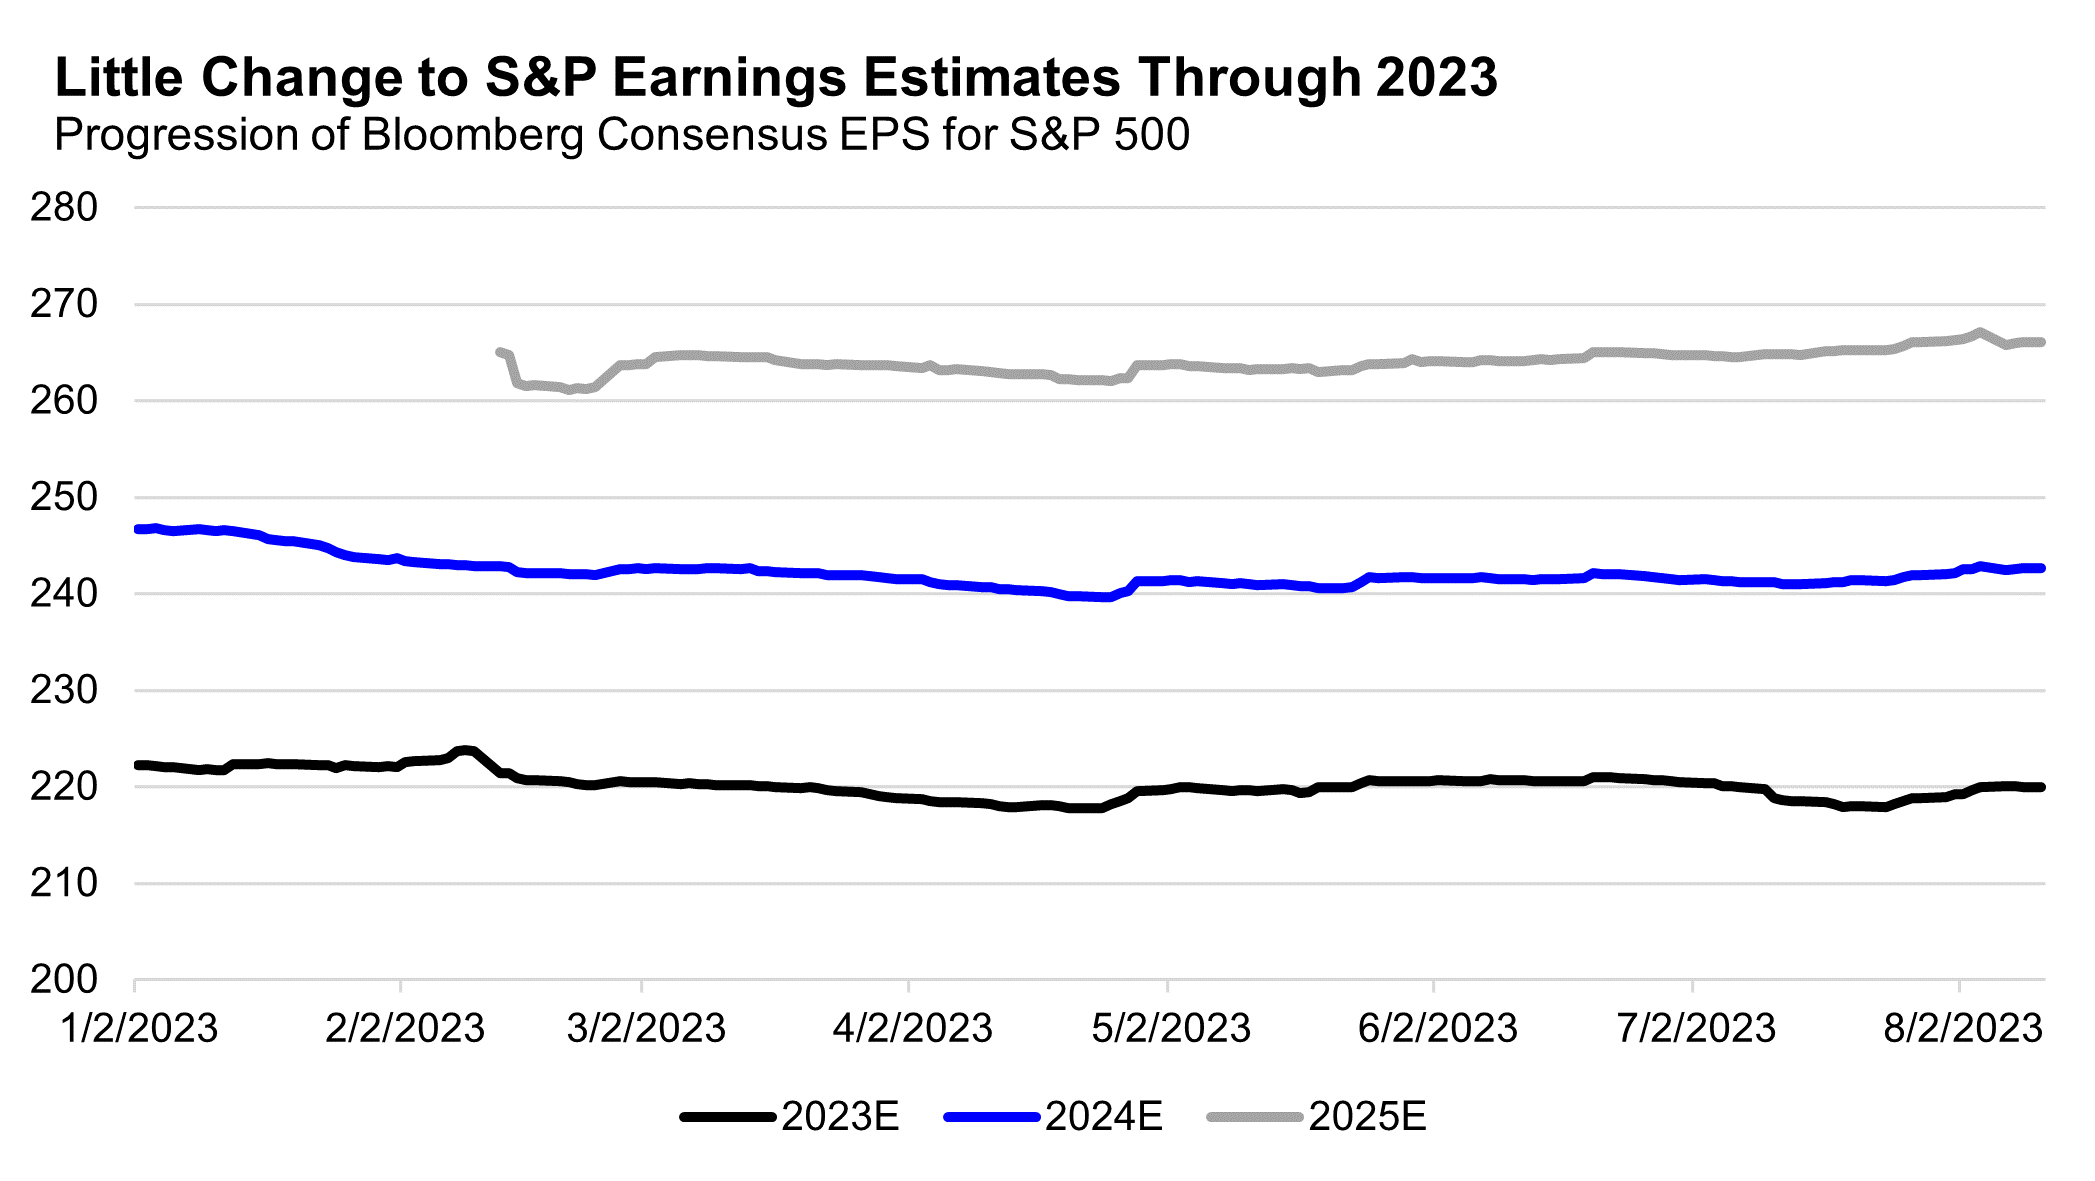
This contrasts to the experience of recent market environments that were driven by changes in earnings expectations and outcomes. Take 2H22, when earnings estimates for 2023 were revised lower by ~9%, contributing to equity market downside as analysts tempered their optimism about future growth. Or take the experience of 2021, where earnings were continuously revised higher as the +40% YoY earnings growth for 2021 was double the initially expected +20%, helping drive the strong upside performance for equities in that year.
For tech, we have seen a slight lift to earnings estimates for 2023-2025, but these revisions are small compared to the size of the rallies and the degree of valuation expansion.

The lack of earnings revisions, or earnings volatility, reflects the benign economic environment of 2023 (better economic data essentially confirmed the perpetual optimism of sell-side earnings estimates), but also reveals some of the fragility in the recent valuation-driven rally, as hopes for better growth, as captured by higher valuations, have yet to be confirmed by actual or forecasted earnings. Time is a friend on this front, as 2023 comes to an end, more of 2024’s forecasted growth is included in 12-month forward earnings estimates (assuming 2024’s growth materializes!).
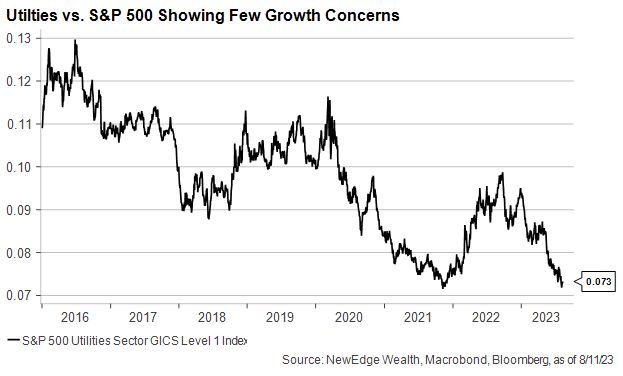
The recent stability in earnings estimates is also confirmed by current market leadership, where weak markets have not resulted in a rush to risk-off defensive sectors like Utilities and Staples, which typically outperform in periods where investors are concerned about future earnings growth. We will watch defensives’ relative performance for signs of future growth concerns.
In the near term, we do expect this corrective phase for equity markets to continue, with a tough seasonal stretch for the S&P 500 continuing into October. We will continue to monitor the important support levels for indices outlined above for signs of resilience or weakness, potentially providing opportunities for investors who are under-allocated to equities to achieve better entry points.
For those areas of the market with the bends, experiencing sharper corrections after bigger rallies, there could be more valuation de-rating to occur, mostly in the context of rising long-term interest rates calling into question historically elevated valuations.
Lastly, and as we have discussed frequently, high valuations do put the onus on earnings to deliver further upside for equity markets, while high valuations also make markets more sensitive to downside earnings surprises (as was experienced over the course of 2022). We will continue to monitor the progression of earnings estimates and all its drivers, such as recession risk, as a key factor for market returns in the coming months.
Top Points of the Week
By Austin Capasso, Jack Dennis, and Connor Finnigan
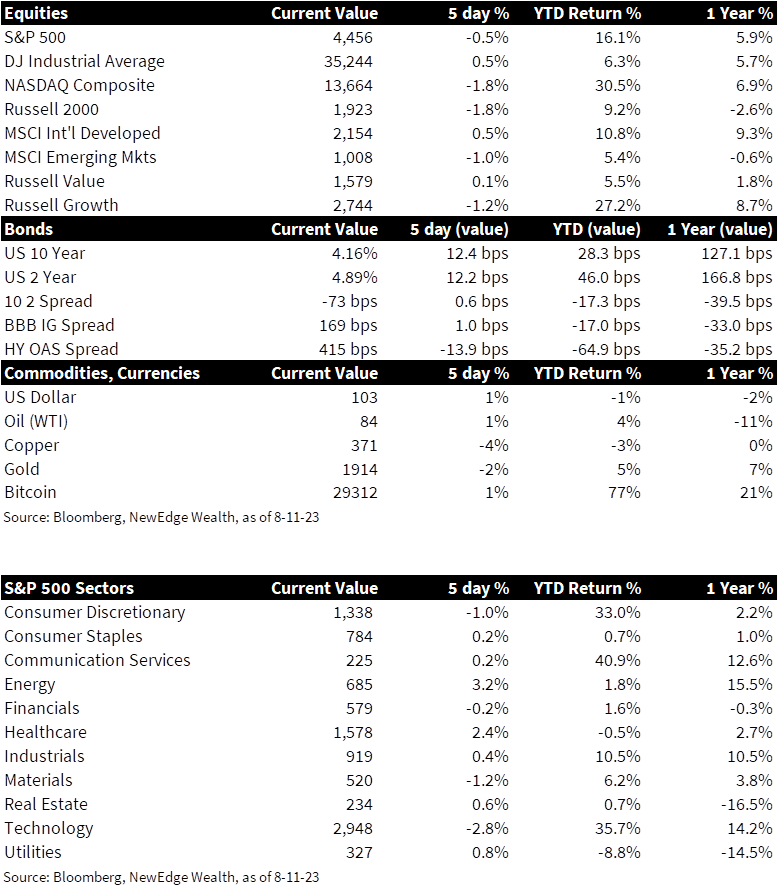
1. US equities struggle to finish the week – All three major US equity took losses this week. The S&P 500, Nasdaq, and Dow Jones Industrial indexes all ended the week in the red. The Nasdaq had the largest loss this week at 2.28%, followed by the S&P 500 falling 0.77% and the Dow Jones down a modest 0.04%. This continued downtrend from last week due to concerns about incoming inflation data and credit rating downgrades to banks last week.
2. Bear steepener event in yields – Over the last several days, we have seen the beginnings of what seems to be a bear steepening of the yield curve. A bear steepener is a rare occurrence during an inversion, where long term yields rise faster than short term yields. In the last 4 yield curve cycles going from inversion to flat, we have never seen long yields rise as the driver of the reinversion. This event can be attributed to the yield curve inversion, weak demand for long-term bonds, lack of bonds purchased by banks, and renewed strength in commodities (particularly energy).
3. July CPI comes in less than expected – Headline CPI rose 3.2% from a year ago in July versus 3.3% expected, while in line with expectations at 0.2% on a month over month basis. Core CPI also increased 0.2% for the month, matching the estimate and equating to a 12-month rate of 4.7%, the lowest since October 2021. Markets reacted positively to the report despite lurking signs of stickiness with a slight uptick to supercore CPI.
4. July PPI surprises to the upside – The U.S. producer price index marked its largest gain since January after rising 0.3% in July, which is up from a revised flat reading in June. Core PPI rose 0.2% in July, up from a 0.1% gain in the month prior. After a positive CPI report, the PPI reading has demonstrated that the “all clear” on inflation cannot be declared just yet, and neither can another rate hike from the Fed.
5. UK GDP higher than expected – UK GDP grew by 0.5% in June. The UK continues to show resilience despite expectations of stagflation. As the UK continues to fight expectations of a recession, attentions will now shift to next week’s inflation data and the Bank of England’s decision on potential interest rate hikes.
6. Reopening of Chinese tourism – Following the lift of its last COVID-19 travel restrictions, the Chinese are now allowed to visit over 70 countries. This is after China implemented strict lockdowns and travel controls within the country after the virus was detected in 2019. About 30% of the 31.8 million total foreign tourists in 2019 pre-pandemic were from China, so this change should provide a lift to the global economy.
7. Weakening of credit growth in China – Weak credit readings have added to the already struggling Chinese economy. Even with interest rates being cut down, lending is tapering off. Chinese banks extended $47.80 billion worth of new loans in July, falling 89% from June and far below expectations to the lowest amount since late 2009.
8. Oil moves toward its seventh weekly gain – Oil is headed for its longest string of weekly gains since mid-2022, driven by heightened demand forecasts and concerns over supply disruptions. OPEC projections indicate strong demand while supply worries persist because of extended Saudi oil production cuts. With WTI trading above $83, analysts predict prices could reach $90 by September, and downstream markets are feeling the impact of tightening oil supplies.
9. Second quarter earnings update – Just about 90% of the S&P 500 have reported their second quarter earnings. 81% of companies are beating estimates by a median of ~7%. The other 19% are missing by a median of –6%. Earnings season is nearing its end and it is becoming evident that the market is showing resilience, but there still remain concerns about inflation and pricing power coming to the forefront in the latter part of 2023.
10. Next Week: Retail Sales, Import Price Index, and Industrial Production – In the upcoming week, there are several reports that will hold significant implications for the broader US economy. Following the release of the CPI and PPI reports for July, it will be important to see a more impacts of price dynamics and production trends to the US economy.
IMPORTANT DISCLOSURES
Abbreviations: ARKK Innovation ETF: the Fund is an actively-managed exchange-traded fund that will invest under normal circumstances primarily (at least 65% of its assets) in domestic and foreign equity securities of companies that are relevant to the Fund’s investment theme of disruptive innovation; Core CPI: measures the changes in the price of goods and services, excluding food and energy; Core PPI: measures the change in the selling price of goods and services sold by producers, excluding food and energy; CPI: Consumer Price Index; Headline CPI: the raw inflation figure reported through CPI that calculates the cost to purchase a fixed basket of goods to determine how much inflation is occurring in the broad economy; Organization of the Petroleum Exporting Countries (OPEC) – The Organization of the Petroleum Exporting Countries is a cartel consisting of 13 of the world’s major oil-exporting nations that aims to regulate the supply of oil in order to set the price on the world market; PE: price to earnings ratio, the ratio of share price of a stock to its EPS; PPI: Producer Price Index; Supercore inflation: goods and services inflation minus food, energy, and housing and Serves as an inflation gauge to diagnose the pace of inflation and the current and future health of the U.S. economy; West Texas Intermediate (WTI) Crude: refers to a grade or a mix of crude oil, and/or the spot price, the futures price, or the assessed price for that oil; colloquially WTI usually refers to the price of the New York Mercantile Exchange WTI Crude Oil futures contract or the contract itself.
Index Information: All returns represent total return for stated period. S&P 500 is a total return index that reflects both changes in the prices of stocks in the S&P 500 Index as well as the reinvestment of the dividend income from its underlying stocks. Dow Jones Industrial Average (DJ Industrial Average) is a price-weighted average of 30 actively traded blue-chip stocks trading New York Stock Exchange and Nasdaq. The NASDAQ Composite Index measures all NASDAQ domestic and international based common type stocks listed on the Nasdaq Stock Market. Russell 2000 is an index that measures the performance of the small-cap segment of the U.S. equity universe. MSCI International Developed measures equity market performance of large, developed markets not including the U.S. MSCI Emerging Markets (MSCI Emerging Mkts) measures equity market performance of emerging markets. Russell 1000 Growth Index measures the performance of the large- cap growth segment of the US equity universe. It includes those Russell 1000 companies with relatively higher price-to-book ratios, higher I/B/E/S forecast medium term (2 year) growth and higher sales per share historical growth (5 years). The Russell 1000 Value Index measures the performance of the large cap value segment of the US equity universe. It includes those Russell 1000 companies with relatively lower price-to-book ratios, lower I/B/E/S forecast medium term (2 year) growth and lower sales per share historical growth (5 years). The BBB IG Spread is the Bloomberg Baa Corporate Index that measures the spread of BBB/Baa U.S. corporate bond yields over Treasuries. The HY OAS is the High Yield Option Adjusted Spread index measuring the spread of high yield bonds over Treasuries.
Sector Returns: Sectors are based on the GICS methodology. Returns are cumulative total return for stated period, including reinvestment of dividends.
The views and opinions included in these materials belong to their author and do not necessarily reflect the views and opinions of NewEdge Capital Group, LLC.
This information is general in nature and has been prepared solely for informational and educational purposes and does not constitute an offer or a recommendation to buy or sell any particular security or to adopt any specific investment strategy.
NewEdge and its affiliates do not render advice on legal, tax and/or tax accounting matters. You should consult your personal tax and/or legal advisor to learn about any potential tax or other implications that may result from acting on a particular recommendation.
The trademarks and service marks contained herein are the property of their respective owners. Unless otherwise specifically indicated, all information with respect to any third party not affiliated with NewEdge has been provided by, and is the sole responsibility of, such third party and has not been independently verified by NewEdge, its affiliates or any other independent third party. No representation is given with respect to its accuracy or completeness, and such information and opinions may change without notice.
Investing involves risk, including possible loss of principal. Past performance is no guarantee of future results.
Any forward-looking statements or forecasts are based on assumptions and actual results are expected to vary from any such statements or forecasts. No assurance can be given that investment objectives or target returns will be achieved. Future returns may be higher or lower than the estimates presented herein.
An investment cannot be made directly in an index. Indices are unmanaged and have no fees or expenses. You can obtain information about many indices online at a variety of sources including: https://www.sec.gov/answers/indices.htm.
All data is subject to change without notice.
© 2026 NewEdge Capital Group, LLC