


You Can’t Stop the Beat: The Sources of Economic Resilience
(Plus, a Bonus Section! Why Prolonged QE Has Dampened the Impact of Fed Rate Hikes)
You can’t stop an avalanche
As it races down the hill
You can try to stop the seasons, girl
But you know you never will
“You Can’t Stop the Beat”, Hairspray
Try as they might, the Federal Reserve has done little to slow the beat of U.S. economic growth.
It has been just under a year since Chairman Powell gave his curt “pain” speech at Jackson Hole, warning of the economic costs that would need to be endured in order to get inflation under control.
A year on, there is little evidence of that pain: there are now 3.2 million more people employed in the U.S. today than in August of 2022, U.S. real (inflation adjusted) economic output has been $1.4 trillion higher in the last year than in the year prior to Powell’s speech, and household assets, after dipping in early 2022 with stock and housing prices, have been rising for a year.
Of course, there have been pockets of stress, but these have had minimal impact on the broad economy as of yet. For example, the spring’s multiple regional bank failures, partially caused by the Fed’s raising rates, were certainly painful for those with direct involvement, but we have yet to see evidence of a widespread “credit crunch” that could slow economic growth.
We can debate if the Fed ever intended to see pain in the economy, meaning the Fed may have simply wanted to talk tough last year in order to get markets to tighten financial conditions and dampen economic activity (another way of saying that the market could do the Fed’s work for it). However, the Fed’s own forecasts reflected an expectation that some economic distress would be felt as it tightened policy.
At the end of 2022, the Fed was expecting a sharp slowdown in real GDP growth in 2023 to just +0.5% (from +2.1% in 2022) and a full percentage point jump in unemployment to 4.6%. Further, the Fed’s staff economists were forecasting a recession in 2023 up until this week’s Fed meeting.
These warnings and forecasts for economic pain by the hands of the Fed have simply not materialized, illustrated clearly by this week’s better-than-expected 2.4% reading on 2Q23 real GDP growth and a whole host of stronger data (personal consumption, durable goods, home prices, initial jobless claims, and consumer sentiment all better-than-expected).
So why hasn’t the Fed “stopped the beat” of economic growth with its interest rate hikes?
The first, glaring reason for resilient growth is that as restrictive as the Fed is trying to be with monetary policy, fiscal policy has been notably stimulative.
Below you can see the budget deficit as a percentage of GDP. It currently sits at ~8.5%. To put this into context, in the depths of the Great Financial Crisis, when GDP was falling and spending was soaring, the deficit to GDP reached 10%. In the past 50 years, this is the first time we have seen such large deficit spending outside of a crisis.
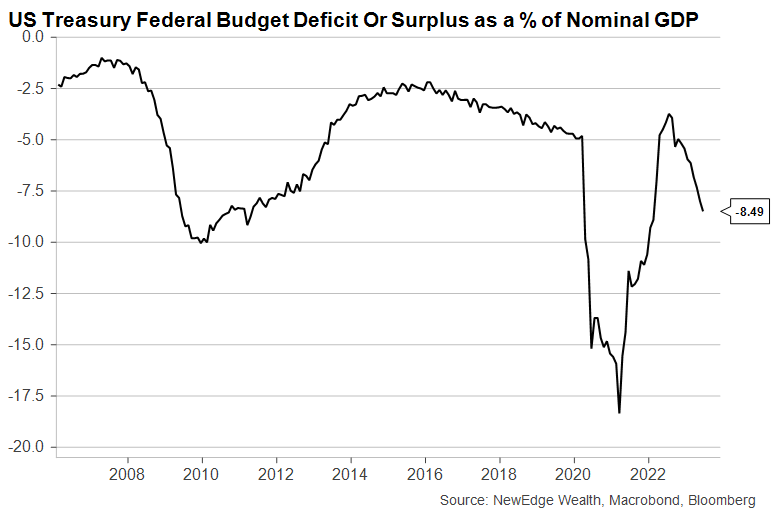
As of: 7/28/23
The second reason for resilient growth is the U.S. economy’s reduced sensitivity to interest rates after over a decade of Quantitative Easing (QE, the Fed’s policy tool of buying bonds and expanding its balance sheet, which can have the impact of lowering long-term interest rates).
We wrote about this dynamic at the beginning of 2023 as a key reason why we did not expect to quickly fall into a recession this year, but it is worth revisiting with some additional perspective (which we do in detail in the BONUS segment below).
For the quick readers, the prolonged suppression on long-term interest rates through QE has dampened the impact of the Fed’s interest rate hikes this cycle, as a greater portion of borrowers locked in low, long-term funding when the Fed was aggressively easing. This means that as the Fed has raised interest rates this cycle, borrowers in aggregate have not felt the same pinch from higher interest expense compared to prior cycles.
We think prolonged QE and the terming out of debt have effectively had the impact of making the long and variable lags of monetary policy even longer and more variable, allowing the U.S. economy to remain more resilient than the Fed and Street economists have been expecting.
Of course, eventually, borrowers could have to refinance their maturing debt at the prevailing higher rates, but at a slower pace compared to prior cycles.
As of: 7/28/23
All of this isn’t to say that we are not seeing signs of stress mounting for some borrowers. In our mid-year outlook, we noted the uptick in consumer credit defaults (still below pre-pandemic levels but rising sharply), as well as the jump in bank loan defaults (which are borrowers who do feel the pain of higher interest rates).
These credit issues have not become significant enough to derail resilient economic growth, which is seeing signs of reacceleration, even in interest rate-sensitive sectors (there was irony in Powell’s comments this week about seeing evidence of tighter policy in the slowing of housing and business fixed investment, which are precisely the areas that are reaccelerating now!).
The trillion-dollar question is if this resilient economy and rebound in cyclical demand will result in higher inflation, or if we can continue to see better growth as inflation moderates (as seen in Friday’s Goldilocks stronger personal consumption data yet softer inflation data).
This question depends, in part, on how much slack remains in the economy in both labor and production (i.e., if demand for labor increases with growth but the labor market is already tight, will wage growth remain too elevated for the Fed’s liking?), while it also highlights the persistent debate about how much of the recent inflation was is truly cyclical/transitory related to supply chain disruptions and exogenous shocks versus inflation that has become more secular and caused by structural changes to the economy (labor markets, globalization, etc.).
We must also acknowledge that just as the Fed has had limited impact “stopping the beat” of growth, it is difficult to argue that their policy has been the source of the bulk of the moderation in inflation. Energy is the clearest example, with gasoline price increases reaching an apex of +60% YoY in June 2022 (contributing 3 pts to the 9% headline CPI reading that month), and a nadir of -30% YoY in June 2023 (detracting 1.5 pts from the 3% headline CPI reading). Note energy prices have started to climb, with gasoline prices now down just -13% YoY and +6% in the month of July.
The implication of a stronger economy on Fed policy is that it supports a higher-for-longer policy stance. We think this means a continued pushing out of and moderation in the pricing of interest rate cuts (expectations of which have gone from a July ’23 start for cuts at the beginning of the year to a December ‘23 start today).
For bonds, stronger growth is likely to keep a floor under interest rates, which we do not expect to break meaningfully lower until signs of economic weakness become more pronounced. For equities, a stronger economy could support upside to earnings forecasts (note a +12% recovery is already forecasted for 2024), while a tighter policy stance and higher interest rates may eventually become a headwind for valuations once positioning and sentiment become further extended (two weeks ago, we wrote about how valuations may not matter for equities until investors become overweight in their equity positioning).
Between strong fiscal spending and the dampened impact of Fed interest rate hikes (see explanation below), we don’t see the Fed “stopping the beat” of the U.S. economy in the near term, but of course, we are always vigilant in watching for deterioration and changes in the trajectory of growth.
BONUS: Why Prolonged QE Has Dampened the Impact of Fed Rate Hikes
If we go back to the adoption of Quantitative Easing (QE) during the Great Financial Crisis (GFC), there were multiple impacts this policy was intended to have, including signaling theory (send a signal to markets that rate hikes were very far away as QE would have to be stopped first), and increasing money supply/bank reserves to spur lending. But the most important, long-lasting impact of QE was/is the suppression of long-term interest rates.
Prior to the adoption of QE, central banks had only an indirect impact on long-term interest rates. Policymakers could raise and lower short-term interest rates, which would filter into the long-end, but these lengthier maturities were mostly controlled by markets. However, by pursuing QE, the Fed and other central banks became market participants themselves, buying bonds in order to put downward pressure on long-term interest rates.
This suppression of long-term rates had two major impacts: it pushed investors “out the risk curve” by making risk-free assets like Treasuries less attractive, spurring the wealth effect as asset prices rose; and, most importantly for this discussion, it allowed companies and consumers to borrow at low rates for the long-term.
Over the past decade, both companies and consumers have been able to “borrow long” and reduce their reliance on debt that is sensitive to changes in short-term interest rates. This “terming out” of debt, borrowing and refinancing long-term, reached a fever pitch in 2020 and 2021 when the Fed aggressively eased policy in response to the pandemic, interest rates plunged, and borrowers rushed to finance at generational low rates.
For the consumer, this terming out was accomplished through mortgages, which constitute 70% of total consumer borrowing. With long-term fixed-rate mortgages falling to such low levels thanks to QE, mortgage borrowers could eschew floating rate mortgages (only 5% of mortgages were floating rate to start 2022 vs. 35% in 2005), and lock in historically low rates all through the last cycle.
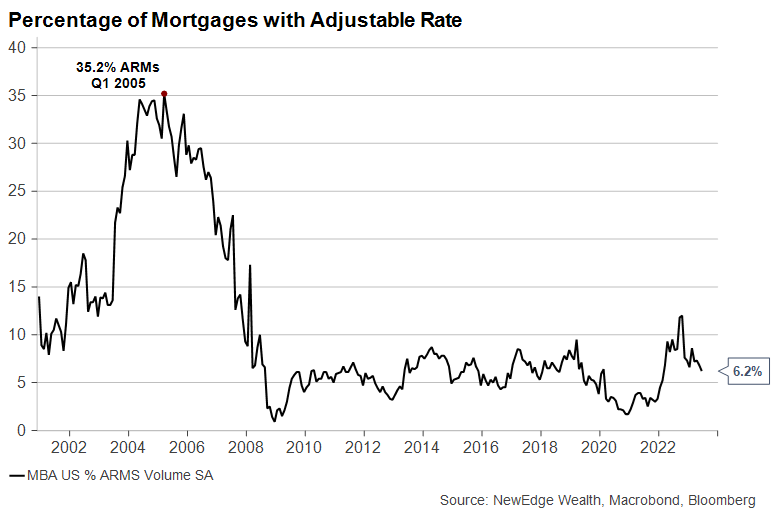
As of: 7/28/23
This means that as the Fed has raised interest rates this cycle, the vast majority of existing borrowers have not seen their mortgage rates reset higher (unlike prior to the GFC where higher Fed rates resulted in some borrowers being unable to afford their existing mortgage, sparking foreclosures and forced sales).
You can see this dynamic at play by comparing the average rate for a new mortgage (7.3%) now being double the effective rate for existing mortgages in the U.S. (3.6%).
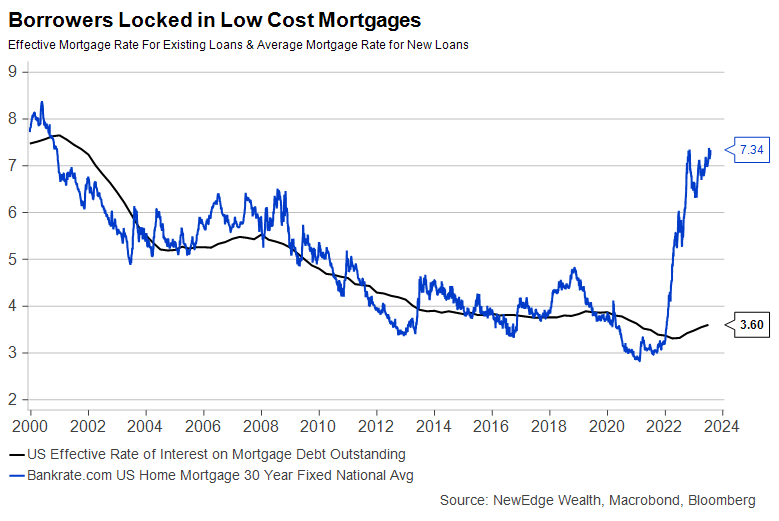
As of: 7/28/23
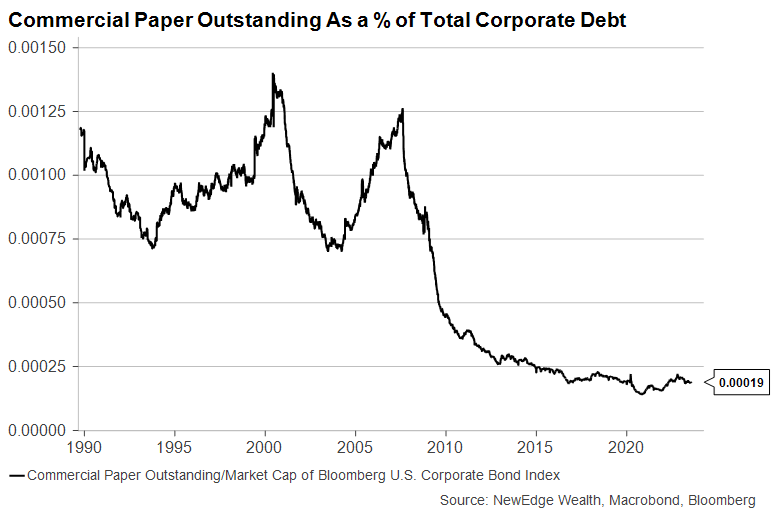
A similar dynamic has played out with corporations over the last decade. Low long-term interest rates, thanks in part to QE, reduced the reliance of companies on short term and floating rate debt, making companies less sensitive to future increases in Fed policy rates.
The chart below shows commercial paper, a form of short-term debt, as a percentage of total debt. Compared to the peaks seen before the last two debt-driven downturns (2000 and 2007), the usage of commercial paper is significantly lower today (it is one-tenth the amount relative to the broader bond market, and 40% lower in absolute terms compared to the 2007 peak).
As of: 7/28/23
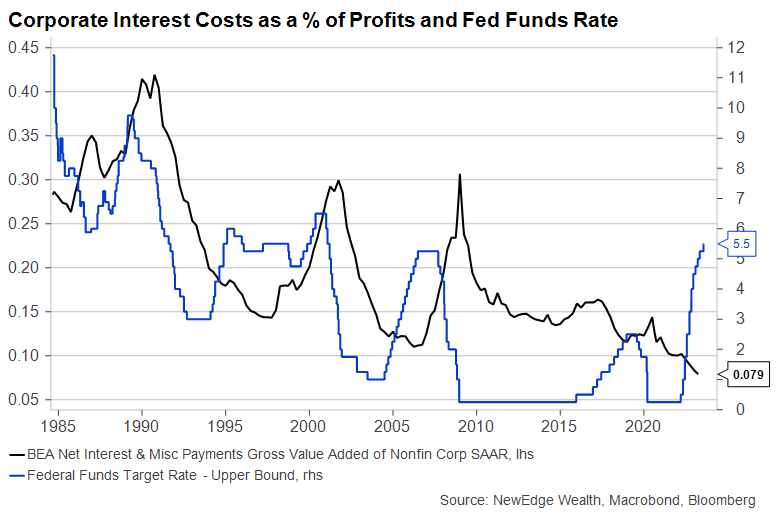
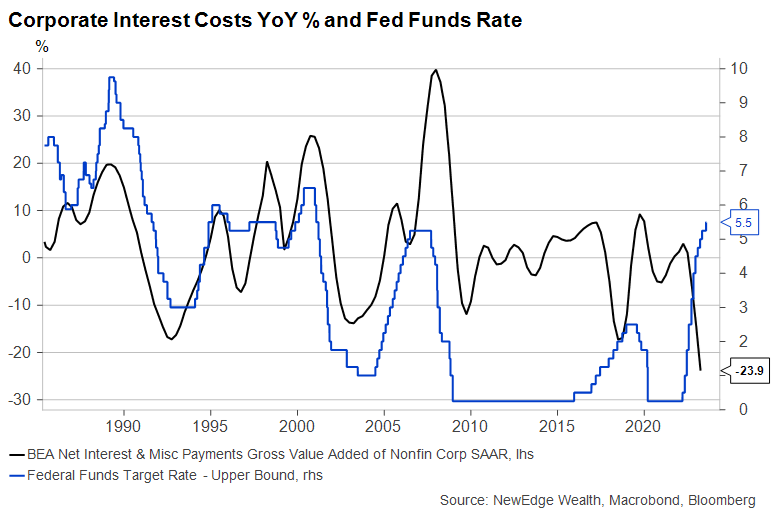
The impact is that as the Fed has raised interest rates, companies, in aggregate, are not seeing their borrowing costs rise as much as prior cycles. In fact, and quite peculiarly, in the Bureau of Economic Analysis data for corporate interest costs, interest expense has actually fallen in recent quarters! The chart below shows how unique this is, compared to prior tightening cycles when higher Fed rates would typically result in rising interest costs.
As of: 7/28/23
Overall, the Fed’s suppression of interest rates through a decade of QE, has effectively made the U.S. economy less immediately sensitive to short term interest rate increases and reduced the Fed’s ability to impact the economy through changes to the short-term Fed funds rate. The unintended consequence of prolonged QE could be that the traditional “long and variable” policy lags have become even longer and more variable (meaning it will take longer than prior cycles for Fed hikes to be felt by the real economy).
Eventually, borrowers will have to refinance their maturing debt at the prevailing higher rates, but at a slower pace compared to prior cycles. If long rates remain elevated, we could see borrowers increasingly turn to shorter term and floating rate debt in order to meet obligations (they always say that you sew the seeds of the next crisis in the upcycle!).
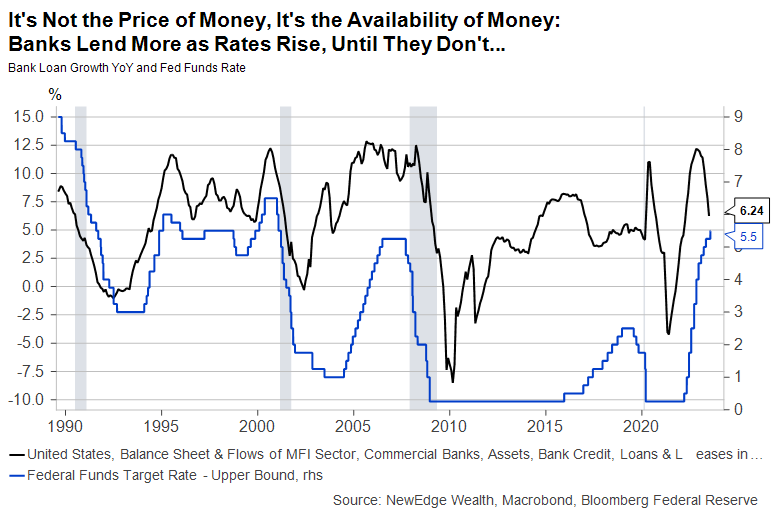
The dampened impact of higher rates on borrowers in the short term allows for the stimulative effects of higher interest rates (increased interest paid to savers, greater appetite for lenders to lend at higher rates – chart below) outweigh the restrictive effects of higher borrowing costs (score one for Mr. Mosler).
As of: 7/28/23
The above below shows how banks’ lending growth accelerates at the start of a rate hike cycle, partially because the economy is strong (allowing the Fed to raise rates) and partially because they simply make more money lending at higher rates! This illustrates how it isn’t the price of money that dictates lending, it is the availability of money, meaning that borrowers will borrow at increasingly high rates until a liquidity or solvency shock halts activity.
Overall, this is a lesson in long-tailed, unintended consequences, with the impact of prolonged QE being less policy effectiveness in the short term. For those that did borrow long these consequences are hugely beneficial: long borrowers have greater visibility and stability in their balance sheets than they have had in any recent hiking cycle. Of course, for those that could not borrow long in the prior cycle, it could mean that they have to tolerate higher for longer rates as the Fed keeps rates elevated given broad economic resilience.
Top Points of the Week
By Ben Lope
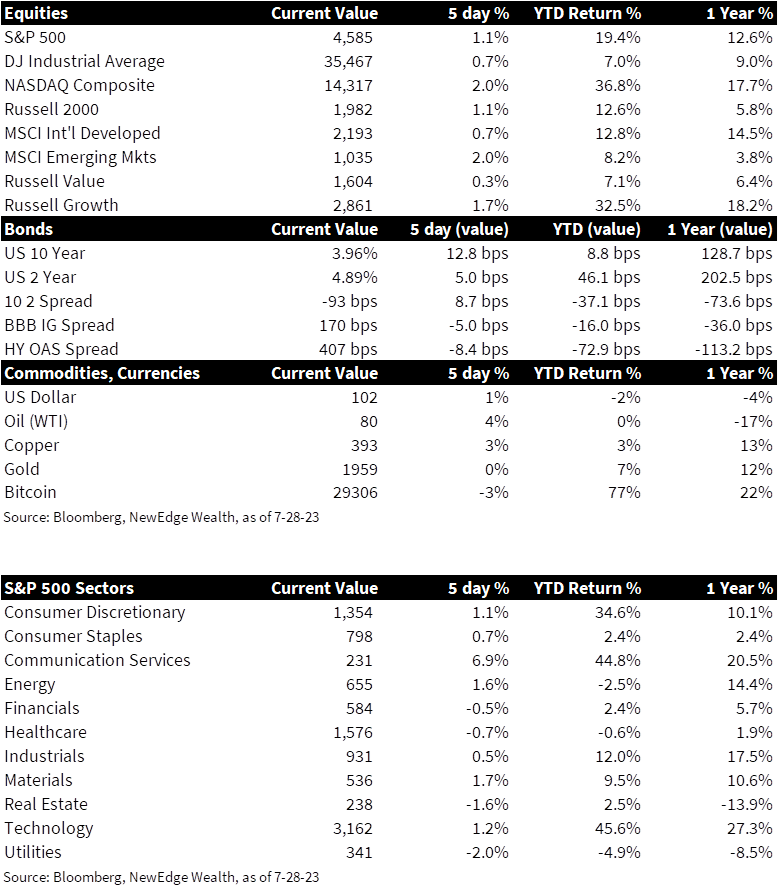
- Global equities notch weekly gains – Global equities moved broadly higher on the week. Despite the Dow Jones Industrial Average snapping a 13-day win streak on Thursday, it still notched a modest weekly increase, but was outpaced by tech and growth stocks, as measured by the NASDAQ Composite and Russell 1000 Growth, respectively. International equities were led by gains in emerging markets; however, developed market indices also posted modest weekly gains.
- Yields move higher, but curve inversion falls below 100bps – Yields on 10-year Treasury bills increased by more than yields on 2-year Treasury yields throughout the week, pulling the level of 2-10-year yield curve inversion back below 100bps. Yields across the maturity curve popped following Thursday’s better-than-expected Q2 Real GDP figures.
- Fed hikes rates to 22-year high – The Federal Reserve hiked rates by 25bps on Wednesday, bringing the federal funds target range to 5.25% – 5.50%, a 22-year high. This marks the eleventh interest rate hike since the Fed began lifting rates in March 2022. Prior to this month’s hike, the median forecast from the Fed’s “dot plot” implied two additional rate hikes by year-end. Chairman Powell signaled that the Fed would continue to be data dependent, making the September, November, and December meetings “live.”
- US Q2 Real GDP grew more than expected – The Commerce Department announced on Thursday that US Real GDP grew at a 2.4% annualized pace in the second quarter of 2023, topping analyst expectations for a 2% annualized increase. This quarterly reading is up from Q1’s reading of 2% and serves as another piece of data in support of the resilience of the US economy. This marks the fourth consecutive quarter of positive GDP growth.
- Fed’s preferred inflation gauge moderates –The June reading for the Core Personal Consumption Expenditures (PCE) price index, a measure of price changes that excludes food and energy and is the Fed’s preferred gauge of inflation, increased by only 4.1% on a year-over-year basis. This is the lowest annual increase since September 2021 and offers an encouraging sign that the Fed’s hawkish policy maneuvers are successfully bringing down inflation.
- Consumer Confidence rises to highest level in two years – On Tuesday the Conference Board announced that the Consumer Confidence Index rose 7 points from June to reach a reading of 117 in July. Rising confidence among consumers is likely a product of inflation decelerating while labor markets remain strong. However, the full report showed that despite the second monthly uptick in the headline index reading, recession fears still loom. The percentage of consumers who expect a downturn within the next 12 months increased slightly month-over-month, from 69.9% to 70.6%.
- Consumer Sentiment increases 11% MoM – The University of Michigan’s Consumer Sentiment Index rose 11% month-over-month, powered by increasingly positive survey assessments of short and long-term business conditions. Importantly for the Fed, the survey showed that inflation expectations remain mostly anchored, with one-year inflation expectations increasing by 0.1% month-over-month to a reading of 3.4%, while five-year inflation expectations remained at 3.0%. These measures remain above the Fed’s 2% target but are down significantly from highs reached in April 2022.
- ECB hikes rates by 25bps – The European Central Bank (ECB) increased rates by 25bps on Thursday, bringing the central bank’s main rate to 3.75%. The ECB began its rate hiking cycle last July when eurozone inflation was nearly 9%. Inflation reached above 10% in late 2022 before steadily moderating to the 5.5% level registered in June. Inflation remains above the ECB’s 2% target, but comments from ECB President Legarde signaled that the bank remains “open-minded” regarding the decision to hike vs. pause at their September meeting.
- Q2 earnings update – 164 S&P 500 companies reported this week, bringing the total number of Q2 announcements from S&P constituents to 243. Of the companies that have reported, 79% beat earnings estimates and 63% beat sales estimates. Mega cap names Microsoft (MSFT), Alphabet (GOOGL), and Meta (META) all reported Q2 top and bottom line beats this week, which, along with positive guidance, sent shares of GOOGL and META up over 8% through the end of the week. MSFT shares moved in the opposite direction and declined modestly after company management articulated that they only expect gradual revenue increases from AI tools.
- Next Week: PMIs, jobs, and more mega cap earnings – Next week’s economic announcements include June JOLTS, July ISM manufacturing and services PMIs, and July Employment figures. Just under half of S&P 500 companies have announced Q2 earnings, and next week’s notable addition to the chorus of Q2 earnings announcements include Amazon (AMZN), Apple (AAPL), and Advanced Micro Devices (AMD)
IMPORTANT DISCLOSURES
Abbreviations/Definitions: Conference Board Consumer Confidence Index (CCI): The Consumer Confidence Index measures how optimistic or pessimistic consumers are regarding their expected financial situation. The CCI is based on the premise that if consumers are optimistic, they will spend more and stimulate the economy but if they are pessimistic then their spending patterns could lead to an economic slowdown or recession; Core PCE: personal consumption expenditures prices excluding food and energy prices; CPI: Consumer Price Index; Dot Plot: The Fed dot plot is published quarterly as a chart showing where each of the 12 members of the FOMC expect the federal funds rate to be for each of the next three years and the long term; ECB: European Central Bank; GDP: gross domestic product; GFC: great financial crisis; Headline CPI: the raw inflation figure reported through CPI that calculates the cost to purchase a fixed basket of goods to determine how much inflation is occurring in the broad economy; ISM Manufacturing PMI: Institute for Supply Management Purchasing Managers Index; ISM Services PMI: The Institute of Supply Management (ISM) services PMI (formerly known as Non-Manufacturing Index) is an economic index based on surveys of more than 400 non-manufacturing (or services) firms’ purchasing and supply executives; JOLTS: Job Openings and Labor Turnover Survey; Quantitative Easing (QE): the Fed’s policy tool of buying bonds and expanding its balance sheet, which can have the impact of lowering long-term interest rates; University of Michigan Consumer Sentiment Index: a survey of personal consumer confidence in economic activity, which is used to estimate future spending and saving.
Index Information: All returns represent total return for stated period. S&P 500 is a total return index that reflects both changes in the prices of stocks in the S&P 500 Index as well as the reinvestment of the dividend income from its underlying stocks. Dow Jones Industrial Average (DJ Industrial Average) is a price-weighted average of 30 actively traded blue-chip stocks trading New York Stock Exchange and Nasdaq. The NASDAQ Composite Index measures all NASDAQ domestic and international based common type stocks listed on the Nasdaq Stock Market. Russell 2000 is an index that measures the performance of the small-cap segment of the U.S. equity universe. MSCI International Developed measures equity market performance of large, developed markets not including the U.S. MSCI Emerging Markets (MSCI Emerging Mkts) measures equity market performance of emerging markets. Russell 1000 Growth Index measures the performance of the large- cap growth segment of the US equity universe. It includes those Russell 1000 companies with relatively higher price-to-book ratios, higher I/B/E/S forecast medium term (2 year) growth and higher sales per share historical growth (5 years). The Russell 1000 Value Index measures the performance of the large cap value segment of the US equity universe. It includes those Russell 1000 companies with relatively lower price-to-book ratios, lower I/B/E/S forecast medium term (2 year) growth and lower sales per share historical growth (5 years). The BBB IG Spread is the Bloomberg Baa Corporate Index that measures the spread of BBB/Baa U.S. corporate bond yields over Treasuries. The HY OAS is the High Yield Option Adjusted Spread index measuring the spread of high yield bonds over Treasuries.
Sector Returns: Sectors are based on the GICS methodology. Returns are cumulative total return for stated period, including reinvestment of dividends.
The views and opinions included in these materials belong to their author and do not necessarily reflect the views and opinions of NewEdge Capital Group, LLC.
This information is general in nature and has been prepared solely for informational and educational purposes and does not constitute an offer or a recommendation to buy or sell any particular security or to adopt any specific investment strategy.
NewEdge and its affiliates do not render advice on legal, tax and/or tax accounting matters. You should consult your personal tax and/or legal advisor to learn about any potential tax or other implications that may result from acting on a particular recommendation.
The trademarks and service marks contained herein are the property of their respective owners. Unless otherwise specifically indicated, all information with respect to any third party not affiliated with NewEdge has been provided by, and is the sole responsibility of, such third party and has not been independently verified by NewEdge, its affiliates or any other independent third party. No representation is given with respect to its accuracy or completeness, and such information and opinions may change without notice.
Investing involves risk, including possible loss of principal. Past performance is no guarantee of future results.
Any forward-looking statements or forecasts are based on assumptions and actual results are expected to vary from any such statements or forecasts. No assurance can be given that investment objectives or target returns will be achieved. Future returns may be higher or lower than the estimates presented herein.
An investment cannot be made directly in an index. Indices are unmanaged and have no fees or expenses. You can obtain information about many indices online at a variety of sources including: https://www.sec.gov/answers/indices.htm.
All data is subject to change without notice.
© 2026 NewEdge Capital Group, LLC

