


There Goes My Hero: Can the Fed Save Day? It Depends on Earnings and Credit Growth
Kudos, my hero
Leavin’ all the mess
You know my hero
The one that’s on
– My Hero, Foo Fighters
Fans of superhero movies know that it is common for villains to transform into heroes. Loki of The Avengers, Harley Quinn of Batman, and Gambit and Deadpool of X-Men all displayed the arc of obstructor-turned-helper.
Today, investors are hoping for real-life protagonist transformation, looking for the Federal Reserve to go from a villain and obstructor of markets, to a hero and helper of markets.
The Fed’s response to regional bank woes, and the resulting expansion in the Fed’s balance sheet, has led many to hope that the Fed’s “villainous”, liquidity draining days are numbered, and that they will soon emerge as a market hero once more, supporting prices with added liquidity.
We have certainly seen a powerful price response in some of the most liquidity sensitive parts of the market, such as crypto, reflecting this heroic optimism.
In last week’s Weekly Edge, we explored why, compared to prior cycles, the Fed may be less ready, willing, and able to step in and support markets at the slightest wobble because of still-elevated inflation and gnawing fears of inflation’s return.
But even if we see further response from the Fed to address banking issues, will the ensuing increase in liquidity be enough to propel equity markets out of their recent malaise?
The answer to this question does depend on the size and breadth of the policy response (we include a special report by our Ben Emons at the end of this piece that lays out why this balance sheet expansion is not your traditional QE). However, the ability for the Fed to be a market hero is also largely dependent on the path of earnings going forward.
While the Rest of Them Peter Out: Earnings Matter
As we outlined in the Weekly Edge from early February, there are times that liquidity is the most important factor for equity market returns.
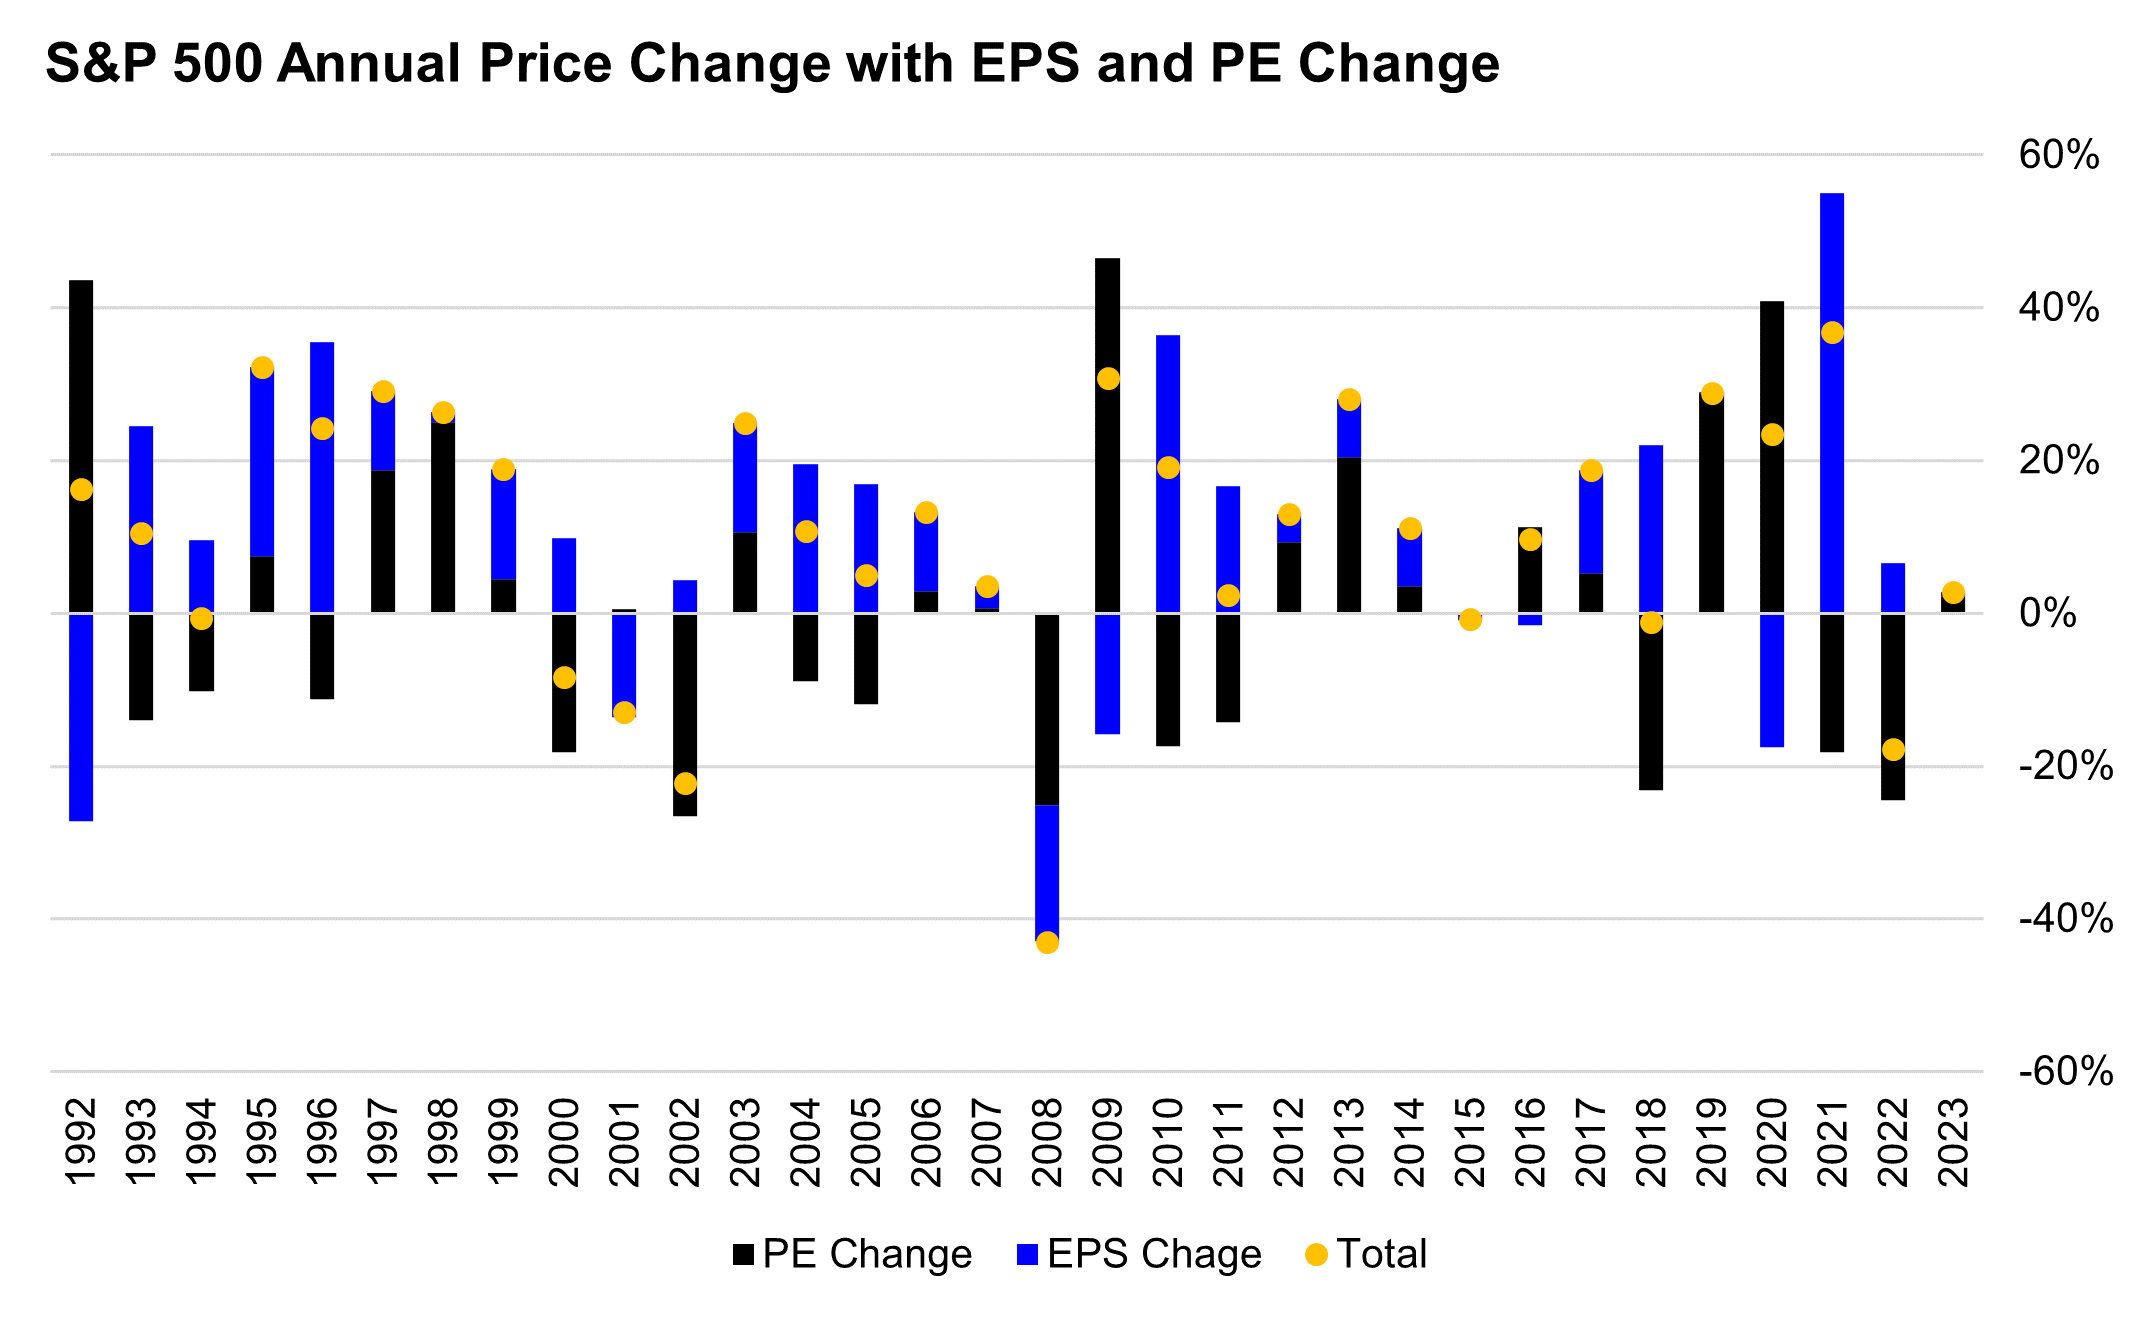
2016 and 2019 are great examples of this dynamic: markets soared in response to policy pivots from the Fed, despite lingering fears of slowing economic and earnings growth. As liquidity became more abundant and money supply growth reaccelerated in both 2016 and 2019, stock valuations rose, resulting in positive S&P 500 returns. The critical factor in both years was that, though there were fears of weaker growth, a recession (neither economic nor earnings) actually materialized. Earnings growth in 2016 and 2019 was 0% and +1%, respectively. The lack of an earnings decline allowed liquidity and PE multiple expansion to be the dominant driver of equity returns.
Contrast this with times like 2001-2002 and 2008. Both of these times saw the Fed cutting rates and adding liquidity to markets, but these monetary policy efforts did little to offset the pain from a sharp decline in earnings (EPS fell -14% in 2001 and -18% in 2008).
Note that multiples continued to fall during these risk-off periods, even with the additional liquidity and lower interest rates (PE multiples fell in -27% 2002 and -25% 2008). This illustrates one of our frequent assertions that the first portion of a move in multiples to the downside is often driven by fundamentals (higher interest rates, tighter liquidity) and the second portion is often driven by emotion (selling out of fear and greater uncertainty about the future). This second half is how markets get “cheap” and why forward returns improve at bear market lows, when valuations are below what is implied by fundamentals.
This leads to the question of what earnings could be in today’s environment, and if there is risk that earnings could fall enough to offset any additional easing/support from the Fed?
Since last summer, when 2023 EPS estimates were a lofty $243, we have been using an estimate range for 2023 S&P 500 EPS of $200 (-10%) to $220 (flat). The flat scenario would imply no recession, but a growth slow down with margin compression. -The 10% scenario would imply a mild recession, with both slightly lower revenue and margins.
We think the events of the past three weeks have both increased the odds of recession and the downside scenario for earnings (how far we have come from the market’s late February “no landing” daydreams!).
Use That Evidence, Race it Around: Credit Contraction?
The reasoning for this higher probability of recession is because of the impact of the credit creation cycle on both economic and earnings growth.
The chart below shows commercial bank loan growth, the Fed Funds rate, and the 2-Year Treasury Yield. Observe that loan growth tends to accelerate and rise through rate hike cycles (banks like issuing loans at higher rates!). Strong loan growth through 2022 (ended the year at +12% YoY), was one reason why economic and earnings growth was so resilient last year, despite fears that rapid Fed tightening would quickly slow growth.
As can be seen in the chart above, there were key points when loan growth began to roll over sharply and a recession soon ensued (for both the economy and earnings).
Interestingly, in the periods before the 1990 Savings & Loan Crisis recession, 2000 bubble bust/corporate balance sheet recession, and 2008 Great Financial Crisis recession, the drop in loan growth did not occur when the Fed was still raising rates. Instead, the plunge in loan growth came once the Fed had already paused or even started cutting rates in response to emerging financial stability issues.
Of course, higher rates and financial stability issues are interrelated, but rate increases alone did not cause the plunge in loan growth (remember loan growth has accelerated as the Fed raised rates!). The discovery of weakness in the financial system (possibly revealed by higher interest rates, such as when deposits leave the banks in search of higher yields), is what caused the decline in loan growth. For example, the peak in loan growth pre-GFC did not come until March 2008, the month that Bear Stearns had to be rescued.
This is an example of those “long and variable lags,” where Fed policy tightening simply takes time to work its way through the financial system.
This leads us to question if the failures of Silicon Valley Bank, Signature Bank, Silvergate Bank, and Credit Suisse are enough of a financial stability issue to cause a plunge in loan growth, which could then slow economic growth, resulting in weaker earnings growth. Weaker earnings could then offset the presumed PE multiple benefit of added liquidity from Fed support.
The path of credit creation is likely the biggest watch item and risk for markets in the coming quarters, as it will drive the probability and magnitude of a potential economic and earnings recession.
At this time, we do not expect a similar degree of credit contraction seen in 2008 because of today’s relative resilience of the largest, most systemically important U.S. banks. However, small banks (those not in the top 25 in size) could experience a sharp drop in their ability and desire to originate loans in response to balance sheet issues (mark to market losses), deposit outflows, and potential credit issues.
According to Federal Reserve H.8 data, small banks are ~40% of current bank lending volumes, while small bank loan growth has been more robust than large banks in recent months as seen below. Note, according to Institute of International Finance data, only about one-third of total U.S. lending comes from banks.
We will watch this bank lending data closely in the coming months for see signs that smaller banks may be pulling back on loan growth. We will also watch deposit and money market data closely to gauge if more banks will come under stress and need Fed/Treasury/FDIC support.
Overall, we think the events of the last week have increased the odds that credit growth begins to fall rapidly, resulting in lower economic growth, and a higher risk of both an economic and earnings recession. If this is the case, the Fed’s current narrow efforts to support banks will likely not be enough of a heroic liquidity boost to offset the earnings decline.
There goes my hero, he’s ordinary…
Top Points of the Week
By Ben Emons and Jay Peters
- Stocks first Rip and then Flip and then Rip Again: The whipsaw action in equities is of note. The S&P 500 Technology sector outperformed by 2% on a perceived “flight to safety” bid, The S&P did not break below key support levels and is not yet oversold on technical measures like the Relative Strength Index. The KBW Regional Bank Index is down by -18% since March 9th, but on the week ended up with a slight gain.
- Yields Collapse: Fears about the banking system sparked a flight to safety into Treasuries and increased bets for more dovish Fed policy in the near future. Yields declined by 10 to 25 basis points across the curve, and the market now expects the first rate cut by June. The yield curve dis-inverted quickly on anticipation that a recession may start as early as the second quarter.
- Banking Crisis update: The resolution of Silicon Valley Bank (SVB) and Signature Bank only briefly calmed concerns about a banking crisis. The quick merger of UBS and Credit Suisse revealed that creditors are not assumed to be senior given the wipeout of AT1 bonds in the takeover deal (Alternative Tier 1 Capital). The uncertainty about whether all deposits are guaranteed in the US added to the confusion with the First Republic and the auction of SVB assets unresolved. Markets remained on edge on Friday as speculation around Deutsche Bank and its widening credit default swap insurance caused bank stocks to sell off.
- FOMC Recap: The Fed delivered a 25-basis points rate hike as expected. The staff economic projections showed a modest downgrade of GDP growth, but the inflation forecast for 2023 was raised. The dot plot showed no change in the median for 2023, but some hawkish Fed members moved their individual estimates higher to 5.625% to 5.875%. Powell said that the SVB crisis may cause a contraction in credit conditions which could tighten financial conditions and have the effective of further rate hikes. Bullard said in a speech on Friday that his projection for Fed Funds is 5.625% and expects financial turmoil to ease as the Fed deploys macroprudential measures.
- US data: While jobless claims are remarkably holding in sub 200K for over two months, the activity in regional manufacturing is plunging. The Philly Fed, Kansas City, and Chicago activity gauge contracted with orders, employment, and production falling sharply. Yet, the decline in interest rates may have boosted new and existing home sales, while the S&P PMI flash estimate was stronger than expected which may bode well for ISM data out from early April that covers the banking turmoil period.
- Coming Up Next Week: The data in focus will be the Fed’s preferred inflation metric, Core PCE deflator. The forecast is a 0.4% monthly gain for the core deflator with the annualized still at an elevated level of 4.7%, more than double the Fed’s target. Powell’s “super core” indicator — core PCE services excluding housing – is expected to rise 0.4% in February (compared to 0.6% in January), and 4.8% year over year, up from January’s 4.7%.
- Other Items Next Week: Other relevant data are Q1 GDP (2.7% estimate) and consumer confidence (101.2 vs. 102.9 previous). Three Fed speakers to watch are Collins, Jefferson, and Waller who are each voting members, and monetary policy is the subject of their speeches.
Special Focus: Why This is Not the Next QE (Yet)
By Ben Emons
Over the past week, the banking system’s liquidity was materially affected by the Fed’s actions.
An estimated $250 billion of deposits left the banking system, and half of that money went into money markets and short-term ETFs according to ICI data. The Federal Home Loan Bank issued $304 billion in debt to boost banks’ access to “cash advances.” The financial system experienced a shock as deposits were quickly withdrawn and reallocated to non-bank entities, including custodians.
In the meantime, excess reserves in the system have increased by $440 billion through a reduction of the Fed’s reverse repo, and cash added overnight through “TOMOs” (overnight repos). The dollar swap lines were drawn by $0.5 billion, the discount window borrowing jumped by $110 billion, and foreign central banks accessed the Fed’s overnight repo for $60 billion.
The net injection of liquidity according to the Fed’s H.4.1. release is close to half a trillion dollars. One could argue that there is a “shadow QE” going on. But this is not necessarily the case. The Fed continued quantitative tightening (“QT”), the rolling off of Treasuries and Agencies on its balance sheet, and instead addressed financial tensions with macroprudential measures, such as the launch of the new Bank Term Funding Program, which gives regional banks access to Fed liquidity.
Quantitative easing works through the Fed purchasing Treasury and Agency bonds and, thereby, adds liquidity (reserves) to the financial system. The purpose of QE is to affect risk-taking behavior by lowering Treasury yields and enticing investors to purchase stocks. Conversely, these liquidity operations are aimed at stabilizing the banks’ access to funding and ensuring smooth operating payment systems. While QE and targeted liquidity injections have a close relationship, they have distinct effects on financial markets.
IMPORTANT DISCLOSURES
Abbreviations:
AT1 Bonds: Additional tier-one bonds, which are bank bonds that are considered a relatively risky form of junior debt; Bullard: James Bullard, President of the Federal Reserve Bank of St. Louis; Collins: Susan Collins, President of the Federal Reserve Bank of Boston; Core PCE: personal consumption expenditures prices excluding food and energy prices; Dot Plot: The Fed dot plot is published quarterly as a chart showing where each of the 12 members of the FOMC expect the federal funds rate to be for each of the next three years and the long term; EPS: Earnings per Share; Flash PMI: an early estimate of the Services Purchasing Managers’ Index (PMI) for a country, designed to provide an accurate advance indication of the final services PMI data; FOMC: Federal Open Market Committee; GFC: Global financial crisis; H.8: presents an estimate of weekly aggregate balance sheets for all commercial banks in the US; QE: quantitative easing; QT: quantitative tightening; PE: Price to Earnings Ratio, the ratio of share price of a stock to its EPS; Powell: Jerome Powell, Chair of the Board of Governors of the Federal Reserve System; Relative Strength Index is a technical indicator intended to chart the current and historical strength or weakness of a stock or market based on the closing prices of a recent trading period; Waller: Christopher Waller, member of the Federal Reserve Board of Governors.
Index Information: All returns represent total return for stated period. S&P 500 is a total return index that reflects both changes in the prices of stocks in the S&P 500 Index as well as the reinvestment of the dividend income from its underlying stocks. Dow Jones Industrial Average (DJ Industrial Average) is a price-weighted average of 30 actively traded blue-chip stocks trading New York Stock Exchange and Nasdaq. The NASDAQ Composite Index measures all NASDAQ domestic and international based common type stocks listed on the Nasdaq Stock Market. Russell 2000 is an index that measures the performance of the small-cap segment of the U.S. equity universe. MSCI International Developed measures equity market performance of large, developed markets not including the U.S. MSCI Emerging Markets (MSCI Emerging Mkts) measures equity market performance of emerging markets. Russell 1000 Growth Index measures the performance of the large- cap growth segment of the US equity universe. It includes those Russell 1000 companies with relatively higher price-to-book ratios, higher I/B/E/S forecast medium term (2 year) growth and higher sales per share historical growth (5 years). The Russell 1000 Value Index measures the performance of the large cap value segment of the US equity universe. It includes those Russell 1000 companies with relatively lower price-to-book ratios, lower I/B/E/S forecast medium term (2 year) growth and lower sales per share historical growth (5 years). The BBB IG Spread is the Bloomberg Baa Corporate Index that measures the spread of BBB/Baa U.S. corporate bond yields over Treasuries. The HY OAS is the High Yield Option Adjusted Spread index measuring the spread of high yield bonds over Treasuries. KBW Nasdaq Regional Bank Index is a modified market capitalization weighted index designed to track the performance of leading banks and thrifts that are publicly traded in the U.S that includes banking stocks representing large U.S. national money centers, regional banks and thrift institutions.
Sector Returns: Sectors are based on the GICS methodology. Returns are cumulative total return for stated period, including reinvestment of dividends.
The views and opinions included in these materials belong to their author and do not necessarily reflect the views and opinions of NewEdge Capital Group, LLC.
This information is general in nature and has been prepared solely for informational and educational purposes and does not constitute an offer or a recommendation to buy or sell any particular security or to adopt any specific investment strategy.
NewEdge and its affiliates do not render advice on legal, tax and/or tax accounting matters. You should consult your personal tax and/or legal advisor to learn about any potential tax or other implications that may result from acting on a particular recommendation.
The trademarks and service marks contained herein are the property of their respective owners. Unless otherwise specifically indicated, all information with respect to any third party not affiliated with NewEdge has been provided by, and is the sole responsibility of, such third party and has not been independently verified by NewEdge, its affiliates or any other independent third party. No representation is given with respect to its accuracy or completeness, and such information and opinions may change without notice.
Investing involves risk, including possible loss of principal. Past performance is no guarantee of future results.
Any forward-looking statements or forecasts are based on assumptions and actual results are expected to vary from any such statements or forecasts. No assurance can be given that investment objectives or target returns will be achieved. Future returns may be higher or lower than the estimates presented herein.
An investment cannot be made directly in an index. Indices are unmanaged and have no fees or expenses. You can obtain information about many indices online at a variety of sources including: https://www.sec.gov/answers/indices.htm.
All data is subject to change without notice.
© 2026 NewEdge Capital Group, LLC

