


Be runnin’ up that road
Be runnin’ up that hill
Be runnin’ up that buildin’
– Running Up That Hill, Kate Bush
We have Netflix and TikTok to thank for the youthful pop culture resurgence of the 1985 classic Kate Bush song “Running Up That Hill”, but it’s a great, long-time favorite track, so we won’t complain. It also is a helpful visual for the current environment for broad equity indices.
We see a “hill” that equities have to confront in 2023: full earnings estimates for 2023 and 2024.
This hill is steep, and likely presents a challenge for broad U.S. equity returns in 2023. Depending on the economic and policy backdrop, these hills could be surmountable, but as you will see in the below analysis, the assumptions that have to be made to climb this hill are somewhat aggressive.
Our base case remains a lackluster year for equity returns in 2023 because of downside risk to earnings and valuations, however as we outlined in our 2023 Outlook, we think investors can stand at the ready advantage of volatility as earnings estimates and valuations become more aligned with reality, or if short-term factors cause a departure from these medium-term fundamentals.
Earnings Hill: Scenario Analysis
S&P 500 Earnings estimates for 2023 have been getting trimmed since the summer of 2022, where they started at $236/share and have now been marched all the way down to ~$221/share, or -1% from 2022’s level.
Presented in the table below, you can see the breakdown of current consensus EPS forecasts for 2023 and 2024, along with three different scenarios for revenue growth and margins.
S&P 500 Earnings with 2023 and 2024 Consensus & 2023 Scenario Analysis
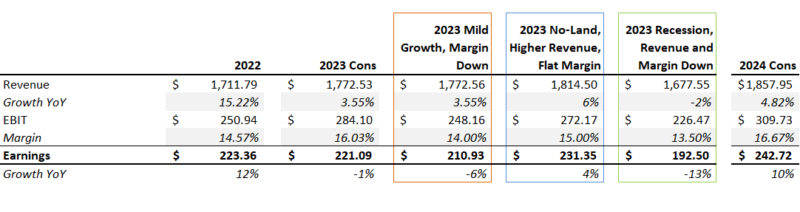
These are very rough estimates, with back of the envelope math (meaning they are top-down and not bottom-up compilations of individual company forecasts). They are meant to illustrate the sensitivities to various assumptions (revenue growth and margin compression/expansion). The model is extremely sensitive to margin assumptions, which is where there could be the biggest swings in potential outcomes.
Here are the key items to note and the takeaways from this analysis:
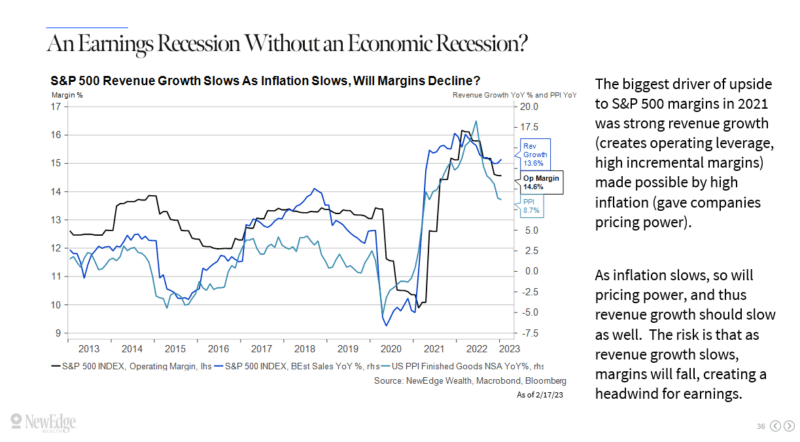
- Margins are the key risk for 2023 estimates: the Street currently has operating margins (EBIT, earnings before interest and taxes) rising to a record high of 16% in 2023. We think this is difficult in an environment where costs are remaining elevated and yet pricing power is starting to fade. As our Jay Peters highlighted two weeks ago, 4Q22 earnings growth was -5% despite 4% revenue growth, all because of 100 bps of margin compression. Because of the dynamic of incremental margins (detailed in the 2023 Outlook, screenshot below), slowing revenue growth alone, down from 2022’s 15% break-neck pace, could result in falling margins YoY. This is why we have been flagging the risk of having an earnings recession even without an economic recession.
- Depending on the timing of a recession, 2024 consensus is likely too high: Last week we floated the idea that the significant lags in policy impacting the real economy could result in a U.S. recession hitting later than expected (even out to 2024). If that is the case, 2024’s estimate for 10% EPS growth does look to be too high. If a recession hits earlier in 2023, then 2023 earnings will likely decline further than the 1% forecast, meaning the base from which 2024 grows would be lower. So when analysts argue for “looking through” earnings in 2023 into 2024, we should note that large earnings growth is not a given two years out.
- Scenario analysis: We like to stress the numbers to the upside and downside, to see where markets could be surprised. Here are three scenarios for upside and downside:
-
- Orange Box: shows the consensus revenue growth forecast but reduces the margin slightly to reflect falling incremental margins. The end result is a slight EPS decline, even without having a recession.
- Blue Box: shows the no-landing scenario, where revenues grow more than forecasted, while margins stay flat with where they were in 2022. This generates a slight rise in EPS.
- Green Box: shows a mild recession scenario, with revenues declining and margins falling back to pre-pandemic levels (margins typically fall further in recessions, so this may be optimistic)
-
We have been using a range of $200-220/share for potential 2023 EPS outcomes, but using this scenario analysis we can expand this range from $190 (mild recession) to $230 (no landing in 2023) to assess an even broader range for the potential outcomes for the S&P 500.
Here is an updated scenario analysis from our 2023 Outlook. The blue box uses a 17x “average” multiple on all of the EPS scenarios, with a broader orange box showing lower and higher valuations. We continue to expect that tight Fed policy and liquidity keeps a lid on valuations, mostly now that the bond market has finally woken up to the Fed’s tighter for longer policy guidance.
S&P 500 Price Outcomes at Various EPS and PE Valuation Combinations
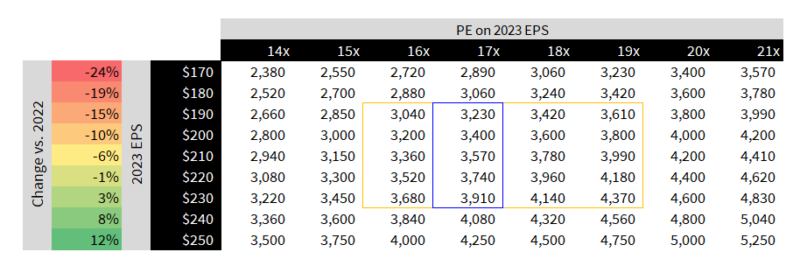
The two extreme ends of these forecasts (low valuation + low earnings) and (high valuation + high earnings) in the corners of the orange box should be used carefully.
On the low end, a low PE plus low earnings rarely persists for long (though we can argue that 16x is historically not low and that -10% in EPS is not deeply depressed). This is because depressed earnings could be followed by easier Fed policy and more abundant liquidity, which could support higher valuations. Note that the PE multiple bottomed in 2022 at 15.5x in both June and October.
On the high end, we do not think that high valuations can be justified at the same time as high earnings. High earnings (which likely require strong growth and high inflation to drive above trend revenue growth) likely mean the Fed stays tight, meaning that it is imprudent to place an elevated valuation (which requires Fed support) on elevated earnings.
Overall, this assessment of potential EPS and valuation outcomes suggests muted returns in 2023. There will of course be times when we could significantly diverge from these outcomes in the short run, driven by factors such as positioning, sentiment, technicals, and emotion. We’ll continue to use these fundamentals as a guidepost and gut-check in assessing the short-term and medium-term potential for returns.
The margin risk, from our 2023 Outlook:
Top Points of the Week
By Ben Emons
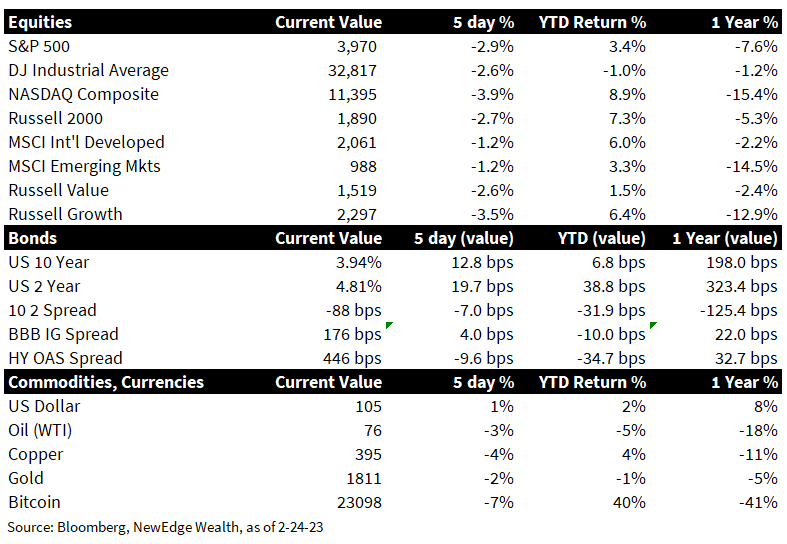
- Stocks Slip: Equity markets struggled with rising Treasury yields, warnings of a weaker outlook for earnings, and concerns about inflation not coming down as fast as hoped. The S&P 500 broke below 4000 and the Dow had the first weekly loss since mid-January with the Transports, the Nasdaq, and Philly Oil services index down 4 to 7 percent. The VIX jumped by 8 percent, the largest weekly gain since early January. The US stock markets underperformed foreign equities by 1 to 2 percent.
- Yields Keep Rising: Treasury yields moved closer to 4% on the 10Y, the highest since December. Markets have priced three full 25 basis points hikes for the next three months. The bond market is discounting the possibility the Fed may have to go further than its forecast from December. The probability of a 50 basis points hikes in March rose to 30%. Bond funds received 8th consecutive weeks of inflows as rates climbed, the longest streak since late 2021. Bond funds received 8th consecutive weeks of inflows as rates climbed, the longest streak since late 2021.
- U.S. Earnings Season: 94% of the S&P companies have reported earnings. The number of positive earnings surprises runs at 68.4%, which is 25 percent below the peak from mid-2021. The sector with the biggest degree of positive surprise is Consumer Discretionary (10.26% above estimates), followed by Energy (10.1%), healthcare, and Utilities (5.3%). Technology is modestly beating (0.8%), while Utilities and Communications are experiencing negative earnings surprises.
- FOMC Minutes: The bond market finally listened to the Fed and fully priced a terminal rate of 5.375%, the level at which Jim Bullard (St. Louis Fed) views as sufficiently restrictive to tackle inflation. The FOMC Minutes from the January 31/February 1 meeting revealed that the Fed was willing to take a slower pace to reach that terminal rate in order to assess the cumulative impact of policy tightening (of course this was prior to recent hot inflation data). In acknowledgment of the persistence of inflation, the FOMC expects that it will take “some time” to achieve the 2 percent target. The debt ceiling was mentioned twice as a near-term risk of the outlook in the event of a political standoff. Disinflation, which Powell mentioned eleven times in the FOMC press conference, was not mentioned in the minutes, while inflation was mentioned 91 times.
- Stickier Inflation Data: The Fed’s preferred measure of inflation, Personal Consumption Expenditures Deflator (PCE), came in hotter than expected across all measures. The Headline PCE came in YoY +5.4% vs. +5.0% consensus and MoM (month-over-month) at +0.6% vs. +0.5% consensus and +0.2% prior. Core PCE was also hotter than expected, with a reacceleration in MoM to +0.6% vs. +0.4% consensus and +0.3% prior. The Fed’s “super core” metric, which is the PCE services excluding shelter and energy, accelerated to +0.6% MoM and +4.6% YoY, clearly moving in the wrong direction. The year-long deflation in core goods PCE ended with the 1 to 12-month annualized averages turning positive.
- GDP and employment: The second estimate of the fourth quarter 2022 GDP was softer on weaker consumer spending in late 2022. There appears to have been a rebound in January spending, as seen in the better PCE spending data, and supported by continued resilience in the labor market, with jobless claims remaining below 200k for the last 8 weeks. The PCE spending and income were stronger (1.8% vs. 1.1% expected), mainly driven by non-durable goods. The savings rate inched up to 4.7%. New home sales surprised with strength not seen since the spring of last year (670K vs. 620K expected), helped by a combination of lower mortgage rates vs. the 2022 peak and slightly lower housing prices.
- Central banks: The new governor of the Bank of Japan, Ueda, said that the current monetary policy is appropriate but confirmed that inflation is too high. He expressed optimism that inflation peaked in January, meaning an upside surprise to inflation in coming months could spur another rethink of the current easy policy stance. The European Central Bank saw several members expressing concerns about too persistent inflation that must be met with sizeable rate hikes (market chatter about the ECB reaching a 4% rate was eye popping after being -0.5% less than a year ago).
- Taiwan Tensions and Ukraine: The US increased the number of troops deployed in Taiwan for “training” and likely out of precaution of increased threats by China. Military exercises by China have picked up as did close encounters between US and Chinese aircraft. The Chinese government posted a 12-step plan for a cease-fire in Ukraine, which was rejected by Russia.
- Coming Up Next Week (Data): The Institute of Supply Chain Management releases the services data, which is forecast for a small improvement (47.9 vs. 47.5 previously). The new orders, inventories, and employment components are of interest because of their forward-looking pulse on the economy. Also watch the price component closely as a potential early signal about inflationary dynamics in February (February’s CPI data is released March 14, one week before the next FOMC meeting).
- Coming Up Next Week (Central Banks and Earnings): Fed board members Jefferson and Waller speak about the economic outlook. Retail earnings are in focus for Target, Lowe’s, Macy’s, and Best Buy, as well as closely watched memes like AMC and C3Ai, and energy and tech names such as Occidental and Dell.
IMPORTANT DISCLOSURES
Abbreviations: 10 2 spread: 10-2 Year Treasury Yield Spread; BPS: Basis points, a unit of measure to describe the percentage change in value or the rate change in an index or other benchmark; CPI: Consumer Price Index; EBIT: Earnings Before Interest and Taxes; ECB: European Central Bank; EPS: Earnings per Share; FOMC: Federal Open Market Committee; Jefferson: Phillip Jefferson, a member of the Federal Reserve Board of Governors; PCE: personal consumption expenditures; PE: Price to Earnings Ratio, the ratio of share price of a stock to its EPS; Powell: Jerome Powell, Chair of the Board of Governors of the Federal Reserve System; Waller: Christopher Waller, member of the Federal Reserve Board of Governors.
Index Information: All returns represent total return for stated period. S&P 500 is a total return index that reflects both changes in the prices of stocks in the S&P 500 Index as well as the reinvestment of the dividend income from its underlying stocks. Dow Jones Industrial Average (DJ Industrial Average) is a price-weighted average of 30 actively traded blue-chip stocks trading New York Stock Exchange and Nasdaq. The NASDAQ Composite Index measures all NASDAQ domestic and international based common type stocks listed on the Nasdaq Stock Market. Russell 2000 is an index that measures the performance of the small-cap segment of the U.S. equity universe. MSCI International Developed measures equity market performance of large, developed markets not including the U.S. MSCI Emerging Markets (MSCI Emerging Mkts) measures equity market performance of emerging markets. Russell 1000 Growth Index measures the performance of the large- cap growth segment of the US equity universe. It includes those Russell 1000 companies with relatively higher price-to-book ratios, higher I/B/E/S forecast medium term (2 year) growth and higher sales per share historical growth (5 years). The Russell 1000 Value Index measures the performance of the large cap value segment of the US equity universe. It includes those Russell 1000 companies with relatively lower price-to-book ratios, lower I/B/E/S forecast medium term (2 year) growth and lower sales per share historical growth (5 years). The “BBB IG Spread” is the Bloomberg Baa Corporate Index that measures the spread of BBB/Baa U.S. corporate bond yields over Treasuries. The HY OAS is the High Yield Option Adjusted Spread index measuring the spread of high yield bonds over Treasuries. The Empire Fed Manufacturing Survey is a monthly survey of manufacturers in New York State conducted by the Federal Reserve Bank of New York with readings above 50 signaling expansion and below 50 contraction. The NASDAQ Transportation Index (“Transports) is a capitalization-weighted stock market index designed to measure the performance of all NASDAQ stocks in the transportation sector. The PHLX Oil Service Sector Index (Philly Oil services) is a modified market weighted index composed of companies involved in the oil services sector. VIX is the ticker symbol for the Chicago Board Options Exchange’s CBOE Volatility Index, a popular measure of the stock market’s expectation of volatility based on S&P 500 index options.
The views and opinions included in these materials belong to their author and do not necessarily reflect the views and opinions of NewEdge Capital Group, LLC.
This information is general in nature and has been prepared solely for informational and educational purposes and does not constitute an offer or a recommendation to buy or sell any particular security or to adopt any specific investment strategy.
NewEdge and its affiliates do not render advice on legal, tax and/or tax accounting matters. You should consult your personal tax and/or legal advisor to learn about any potential tax or other implications that may result from acting on a particular recommendation.
The trademarks and service marks contained herein are the property of their respective owners. Unless otherwise specifically indicated, all information with respect to any third party not affiliated with NewEdge has been provided by, and is the sole responsibility of, such third party and has not been independently verified by NewEdge, its affiliates or any other independent third party. No representation is given with respect to its accuracy or completeness, and such information and opinions may change without notice.
Investing involves risk, including possible loss of principal. Past performance is no guarantee of future results.
Any forward-looking statements or forecasts are based on assumptions and actual results are expected to vary from any such statements or forecasts. No assurance can be given that investment objectives or target returns will be achieved. Future returns may be higher or lower than the estimates presented herein.
An investment cannot be made directly in an index. Indices are unmanaged and have no fees or expenses. You can obtain information about many indices online at a variety of sources including: https://www.sec.gov/answers/indices.htm.
All data is subject to change without notice.
© 2026 NewEdge Capital Group, LLC

