


You make up your mind, you choose the chance you take
You ride to where the highway ends and the desert breaks
Out on to an open road, you ride until the day
You learn to sleep at night with the price you pay
– The Price You Pay, Bruce Springsteen
As we cross the halfway point of the U.S. equity earnings season and given the robust start to the year for risk assets, we find ourselves reflecting on the “price we pay,” specifically as it relates to the value applied to corporate earnings amidst a precarious economic environment. In this week’s Edge, we are taking stock of the recent earnings trends and guidance provided by U.S. companies, and then asking ourselves if these measures and management expectations justify the prices investors are paying today.
As of February 8th, 60% of S&P500 companies have reported their Q4 2022 earnings. As usual, the majority of companies are reporting revenues and earnings above analyst expectations, however at a slightly lower rate than historical averages (70% of companies are beating on earnings vs. 74% 10-year average; 54% of companies are beating on sales vs. 54% 10-year average¹).
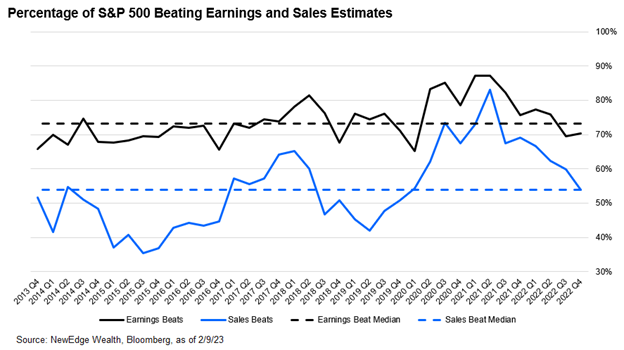
Interestingly, the average earnings surprise of +0.6% is well below the 5-year average surprise of +8.6%, and if these trends continue, it will be the lowest average earnings surprise reported by the index since 2008².
Looking at the absolute data, the trends reflect a slowing global economy and continued pressures on profitability as blended revenues are up 4% year-over-year, but earnings are down -5% year-over-year. This would be the first YoY earnings decline for the index since Q3 2020. This decline in earnings despite growing revenues reflects pressure on margins, with net profit margins coming in at 11.4%, down from 12.4% a year ago.
Looking below the surface, energy has been the leading earnings contributor, posting 58% year-over-year earnings growth, boosted by higher oil prices which averaged $83 in the fourth quarter. Despite only accounting for about 5% of the S&P500 market capitalization, if we exclude the energy sector from our earnings analysis, the S&P500 would be on pace to post a 9% decline in year-over-year earnings and index level profit margins would be even lower.
While a rebound in investor sentiment and incrementally easier financial conditions has contributed to broad multiple expansion and index returns to start 2023, companies that exceed earnings expectations have been more generously rewarded compared to those that missed expectations. In aggregate, companies that posted a positive earnings surprise have seen a subsequent one-day price change of 1.8%, which is double the five-year average and speaks to the importance of security selection and prioritization of margin insulation in the current environment. This dynamic is why we continue to emphasize Quality as an attractive characteristic for equity portfolios.
To take full stock of the earnings environment, we also evaluate management commentary and guidance for the current quarter and the remainder of 2023. While there are a few bright spots in sub-industries like semiconductors and cybersecurity (where demand has thus far exceeded expectations), broad guidance for 2023 has indicated potentially further earnings headwinds ahead.
To date, 86% of companies that provide this information have indicated that they expect first quarter results to be below the mid-point of analyst expectations, led by companies in the Technology and Industrials sectors. This guidance suggests current first quarter analyst expectations for revenue growth of 2% year-over-year and earnings declines of -4% year-over-year may be too optimistic.
The key message from management teams this quarter has been all about cost reduction. Executives have indicated an increased emphasis on profitability, focusing on efficiency, cost reductions, and expense management to help alleviate the pressure on profit margins from slowing economic activity. These comments have been generally well received by investors this quarter, as cost cutting can help defend profit margins, however, investors should be aware that if companies do experience outright declines in revenue growth, cost cutting may not be enough to defend earnings.
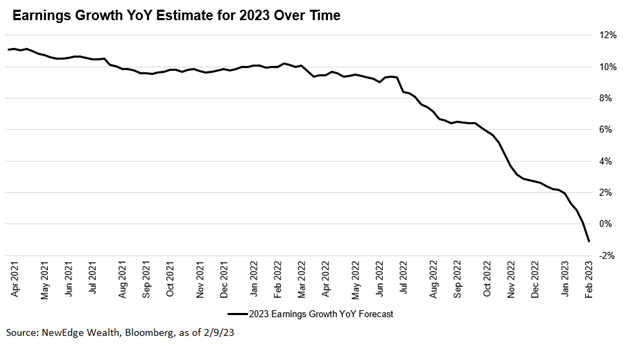
Given this uncertain backdrop, we have continued to see forecasters cut their estimates for 2023 earnings. Bloomberg consensus now expects a decline of -1% for 2023 EPS growth to $220/share compared to expectations for 10% YoY growth in 2023 at this time last year.
All in all, it has been a mixed and somewhat lackluster earnings season with cost control being the central message from management teams as they navigate an uncertain environment. Despite these somewhat uninspiring results, and continued cuts to forward estimates, stock prices have risen materially to start 2023.
So, what does this mean in the context of “the price we pay”?
After the robust rally to start 2023, broad index valuations for U.S. equities are now near their pre-pandemic highs, reflecting a market that we think is richly valued given the deceleration in earnings and the tight liquidity environment. As we discussed in last week’s Weekly Edge, we do not think that valuations can return to pandemic-era ranges, which were only justified by ultra-loose, ultra-stimulative monetary and fiscal policy.
Given we are at the high end of the historical valuation range, ex-the pandemic bubble period, we see renewed valuation risk for U.S. stocks, which could become even more pronounced if earnings estimate cuts continue. This is especially important given the backdrop of the Federal Reserve continuing to promise higher-for-longer policy rates.
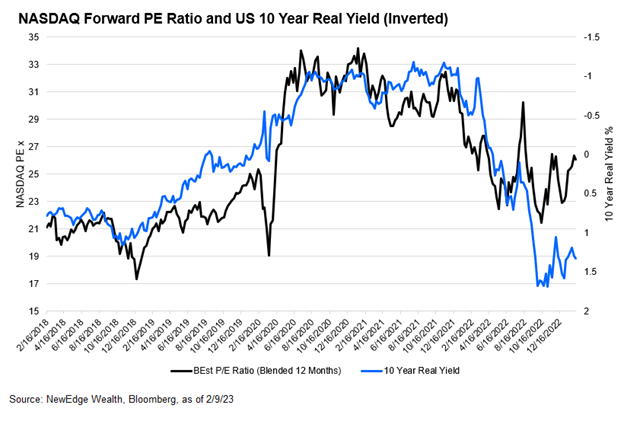
Because earnings continue to get cut, the entirety of 2023’s equity rally has been driven by valuation/multiple expansion. This was initially spurred by a drop in interest rates as bond markets priced in easier policy by the Fed. For example, the 10-year Treasury Real Yield fell from 1.6% to start the year to 1.13% in late January. This gave a boost to rate-sensitive equity valuations, like the NASDAQ, which saw its PE multiple jumps from 23x to 26.5x.
However, as we have seen in the last week, the bond market is waking up to the Fed’s messaging for higher-for-longer rates, which is putting upward pressure on yields (the 10-year real yield is back to 1.35% but NASDAQ valuations haven’t budged). This puts the sharp valuation rally for equities on shaky ground. We would expect valuations to come under renewed downward pressure if interest rates remain high or continue to climb.
Overall, “the price we pay” is now high given the recent rally in the midst of continued cuts to earnings estimates. We continue to favor a valuation-disciplined, quality-focused approach to equities, emphasizing companies that can navigate what is likely to be a continuously challenging economic environment.
Top Points of the Week
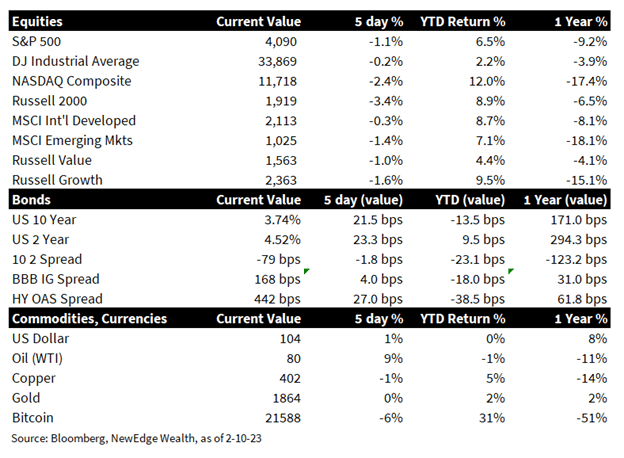
- Stocks Dip: Stocks struggled and posted their first losing week since January after hawkish commentary from Fed officials and the resulting upward pressure on interest rates served to dampen 2023’s early equity optimism. Inflation remains on top of mind next to how accelerating layoffs impact the U.S. economy and earnings. The NASDAQ was down by 3 percent and U.S. stocks fared worse compared to Europe, Asia and emerging markets which fell by 1 percent.
- Yields Rise: Treasury yields moved higher on Fed speakers who emphasized the job was far from done and the “peak rate” may be higher than markets currently expect (~5%). As bets that the Fed will ease policy in 2H23 began to be unwound, 10-year yields rose to a 6-week high despite strong demand at this week’s auction. The 1Y T-bill is near 5 percent with the 2Y back to 4.5 percent reflecting an expectation the Fed may have to go higher.
- Return of the Hawkish Fed Rhetoric: Whenever financial conditions get too loose for comfort, it leads Fed speakers to amp up their hawkish tone. Bostic was the messenger of a higher for longer interest rate and he did not exclude an even higher than 5% funds rate with the possibility of a 50-basis points hike. Powell repeated that the economy is experiencing disinflation, but he cautioned on the inflation outlook. Williams added the Fed may have to keep a restrictive policy in place for a few years.
- U.S. Earnings Season: Over 60% of the S&P companies have reported earnings. The number of positive earnings surprises runs at 70.4%, which is 25 percent below the peak from mid-2021. The sector with the biggest positive surprises is consumer discretionary (13.1% above estimates) followed by healthcare and utilities (6%), while technology is modestly up (0.7%) and industrials and communications had negative earnings surprises. Cost controls continue to be the key message from management teams as they look to defend earnings in the uncertain economic environment.
- Jobless Claims Tick Up: The U.S. jobs market remains resilient, though there was a slight uptick in Initial Jobless Claims during the week (196k vs. 190k consensus and 183k the prior week). Continuing Claims also moved higher (1.69m vs. 1.66m consensus and 1.65m prior). Note both jobless claims measures remain at multi-year lows for this time of year.
- Global Inflation Data is Still Hot: In Brazil, Mexico and China, CPI was stronger than expected driven by food, energy and imported goods. The U.S. Michigan consumer survey showed that gas prices matter again and the expectation for inflation in the next year rose to 4.2% from 4.0% prior. The 5-10 year inflation expectations held steady at 2.9%, one encouraging sign for the Fed that inflation expectations remain “anchored” (the jump higher in these inflation expectations in June 2022 was the key reason why the Fed accelerated its rate hikes to 75 bps). A rebound in used car prices in January (+2%) raised concerns that this key source of goods disinflation in the U.S. in 2H22 could be reversing higher.
- Vigilant Central Banks: The Mexico central bank surprised markets by hiking rates by 50 basis points on concerns about rising core inflation. In Brazil, central bankers face higher inflation even though interest rates are at 13.5%. In Sweden and Australia, after a brief pause, central banks indicated more rate hikes to come. Strong jobs data out of Canada raised concerns that the Bank of Canada’s recent decision to pause rate hikes might have to be reversed. Strong wage data in Japan (+4.8% vs. +2.5% consensus and +0.5% prior) raised concern that the Bank of Japan may have to rethink its easy policy stance in order to combat inflation.
- Bank of Japan Surprise: The Bank of Japan surprised central bank watchers by announcing Kazuo Ueda as the next BOJ Governor. The Yen initially jumped in response, seeing this as a more hawkish pick, and expecting a tighter policy stance that could potentially soften the bank’s commitment to Yield Curve Control. Some of these gains were reversed when Ueda said the current policy should remain, however, given high inflation data, speculators continue to see potential for a departure from the curve control. If the BOJ reverses this policy, it could impact global currency markets (potential strengthening in the Yen) and yields (potential upward pressure on global yields as Japanese investors have more attractive yields in their home currency, reducing demand for foreign bonds).
- China tensions: A Chinese spy balloon saga is causing friction between China and the U.S. It is a renewed geopolitical risk that could play out in a negative way for markets. Yet, the trade balance data this week showed that commerce between China and the U.S. is increasing, especially for consumer goods such as PCs and video games.
- Coming Up Next Week: Front and center are U.S. CPI out next Tuesday. The consensus expects a month-on-month change of 0.5%, which is much higher than the previous month at -0.1%. Energy, food and gas prices could have an impact and cause an upside surprise. Other relevant data are retail sales which are expected to improve to 1.7% from last month’s negative print. Fed speakers are Bullard who speaks on policy on Thursday and is closely watched for comments on how high-interest rates may have to go. Earnings release highlights are Palantir, Biogen, Coke, WeWork, Door dash, DraftKings, Roku and Devon Energy.
SOURCES
¹ Bloomberg, as of 2/9/23
² FactSet, as of 2/9/23
IMPORTANT DISCLOSURES
Abbreviations: 10 2 spread: 10-2 Year Treasury Yield Spread; Bostic: Raphael Bostic, President of the Federal Reserve Bank of Atlanta; Bullard: James Bullard, President of the Federal Reserve Bank of St. Louis; CPI: Consumer Price Index; EPS: Earnings per Share; Fedspeak: refers to speeches about monetary policy given by members of the U.S. Federal Reserve Bord of Governors; Powell: Jerome Powell, Chair of the Board of Governors of the Federal Reserve System; Williams: John Williams, President of the Federal Reserve Bank of New York; Yield Curve Control refers to a monetary policy action whereby a central bank purchases variable amounts of government bonds or other financial assets in order to target interest rates at a certain level.
Index Information: All returns represent total return for stated period. S&P 500 is a total return index that reflects both changes in the prices of stocks in the S&P 500 Index as well as the reinvestment of the dividend income from its underlying stocks. Dow Jones Industrial Average (DJ Industrial Average) is a price-weighted average of 30 actively traded blue-chip stocks trading New York Stock Exchange and Nasdaq. The NASDAQ Composite Index measures all NASDAQ domestic and international based common type stocks listed on the Nasdaq Stock Market. Russell 2000 is an index that measures the performance of the small-cap segment of the U.S. equity universe. MSCI International Developed measures equity market performance of large, developed markets not including the U.S. MSCI Emerging Markets (MSCI Emerging Mkts) measures equity market performance of emerging markets. Russell 1000 Growth Index measures the performance of the large- cap growth segment of the US equity universe. It includes those Russell 1000 companies with relatively higher price-to-book ratios, higher I/B/E/S forecast medium term (2 year) growth and higher sales per share historical growth (5 years). The Russell 1000 Value Index measures the performance of the large cap value segment of the US equity universe. It includes those Russell 1000 companies with relatively lower price-to-book ratios, lower I/B/E/S forecast medium term (2 year) growth and lower sales per share historical growth (5 years). The “BBB IG Spread” is the Bloomberg Baa Corporate Index that measures the spread of BBB/Baa U.S. corporate bond yields over Treasuries. The HY OAS is the High Yield Option Adjusted Spread index measuring the spread of high yield bonds over Treasuries. The Empire Fed Manufacturing Survey is a monthly survey of manufacturers in New York State conducted by the Federal Reserve Bank of New York with readings above 50 signaling expansion and below 50 contraction.
The views and opinions included in these materials belong to their author and do not necessarily reflect the views and opinions of NewEdge Capital Group, LLC.
This information is general in nature and has been prepared solely for informational and educational purposes and does not constitute an offer or a recommendation to buy or sell any particular security or to adopt any specific investment strategy.
NewEdge and its affiliates do not render advice on legal, tax and/or tax accounting matters. You should consult your personal tax and/or legal advisor to learn about any potential tax or other implications that may result from acting on a particular recommendation.
The trademarks and service marks contained herein are the property of their respective owners. Unless otherwise specifically indicated, all information with respect to any third party not affiliated with NewEdge has been provided by, and is the sole responsibility of, such third party and has not been independently verified by NewEdge, its affiliates or any other independent third party. No representation is given with respect to its accuracy or completeness, and such information and opinions may change without notice.
Investing involves risk, including possible loss of principal. Past performance is no guarantee of future results.
Any forward-looking statements or forecasts are based on assumptions and actual results are expected to vary from any such statements or forecasts. No assurance can be given that investment objectives or target returns will be achieved. Future returns may be higher or lower than the estimates presented herein.
An investment cannot be made directly in an index. Indices are unmanaged and have no fees or expenses. You can obtain information about many indices online at a variety of sources including: https://www.sec.gov/answers/indices.htm.
All data is subject to change without notice.
© 2026 NewEdge Capital Group, LLC

