


Note: This piece is not about friendly adolescent dinosaurs going on a Hero’s Journey, but it is a great pun to talk about the limitations of recent debates about economic “landings”.
In the span of just two months, the dominant market narrative has shifted from hard landing, to soft landing, to no landing. Markets have gone from expecting an imminent recession, to expecting immaculate disinflation (a rapid deceleration in inflation at no expense to growth), to expecting a continuation of resilient growth and elevated inflation.
This evolution of the landing debate, and this week’s robust economic data, has led many to ask the question: how can the economy be so resilient after the Fed has tightened policy so meaningfully?
We think there are two key, interrelated factors that drive the answer to this question: time and short-term rate sensitivity after a decade of ZIRP. Hence, “no land before time”.
First, this resilience in the U.S. economy could simply be a function of time. The Fed points to the “long and variable lags” of how monetary policy impacts economic activity (i.e., jobs) and statistics (i.e., inflation)[1]. This essentially means that the Fed’s tightening of policy does not immediately impact the real economy.
As we have experienced in past cycles and certainly in 2022 and 2023, it is financial markets and interest rate sensitive sectors, such as housing and autos, that get hit first by the Fed’s projected and actual policy tightening. It can then take years for this weakness to spread and result in broad economic malaise.
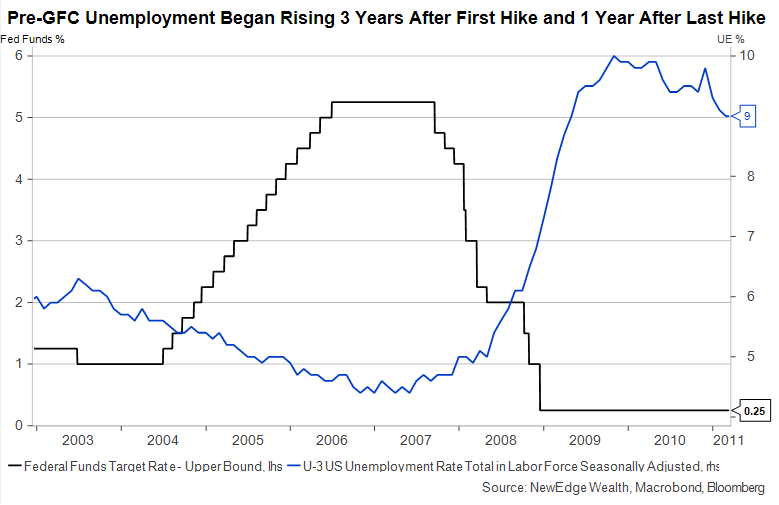
For example, prior to the Great Financial Crisis, the Fed started hiking rates in 2004 but unemployment didn’t begin rising significantly until late 2007. In fact, unemployment did not start rising until a year after the Fed paused its rate hikes.
But even within interest rate sensitive sectors, like housing, there can be significant lags in real activity/data. Housing sentiment (National Association of Home Builders Market Index) peaked in June 2005, about one year after the Fed started raising rates, but housing construction employment didn’t peak until April of 2006.

So this leads us to argue for “No Land Before Time”, meaning the character of the “landing” (soft or hard) post the Fed hikes will take time to develop, and that strong/resilient data in the short-term does not rule out the eventual impact of higher rates in the future.
The second rationale for recent sturdiness in data may serve to extend this time factor further. There is an argument that, after a decade of aggressive Fed intervention, ultra-loose liquidity, and zero interest rate policy, the U.S. economy is less immediately sensitive to short-term interest rates than it was in prior cycles, despite higher overall debt levels.
Many corporate and consumer borrowers used the decade-plus of ultra-low interest rates to borrow at very low rates at longer maturities, effectively reducing their sensitivity to short-term rate increases.
One example of this is with consumer mortgages. Going into the GFC, adjustable-rate mortgages reached a peak of 35% of total mortgage volumes. When the Fed started raising rates in 2004, many homeowners were priced out of their existing mortgages, which caused foreclosures and forced sales that contributed to sharp housing price weakness.
In contrast, at the beginning of 2022’s hiking cycle, only 5% of mortgages were floating rates, so as rates rose, the vast majority of borrowers were impervious to the jump in rates. Of course, higher rates have impacted housing activity, as new buyers and home switchers face much higher mortgage costs, but the degree of housing pain has been dampened by the dominance of fixed borrowing at historically low rates.

A similar story can be told in the corporate sector, where companies have used the last decade of ultra-low long-dated rates to reduce their reliance on short-term borrowing.
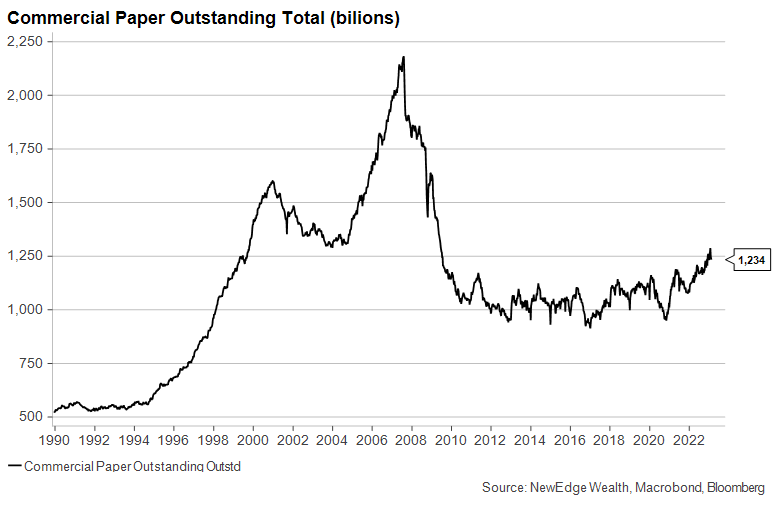
We can see this by looking at Commercial Paper volumes. Commercial Paper is very short-term borrowing that is often used by companies to fund short-term needs, like working capital.
Commercial Paper and other short-term borrowing were also at the heart of many of the corporate implosions of the early 2000’s recession and GFC. Many remember the story of ENRON as an accounting scandal of fraudulent earnings, but what revealed this malfeasance was the company’s reliance on short-term borrowing to fund long-term investments. As the Fed hiked rates in the late 2000s, ENRON’s funding costs ballooned and eventually led to its downfall.
However, since the GFC, very low long-term interest rates have allowed companies to significantly reduce their reliance on short-term funding, like Commercial Paper, effectively making their balance sheets less sensitive to Fed policy tightening.
Overall, balance sheets that have longer term borrowing do not have to refinance as often, meaning they are less impacted by short-term interest rate increases. Of course, refinances eventually occur, so the pinch from high interest rates will eventually be felt, but more delayed compared to balance sheets that are shorter term.
Putting it all together, we see reason for U.S. economic growth to remain more resilient than current consensus forecasts (Bloomberg still has a 65% probability of recession in the next twelve months) because of these factors of time lags and longer-term balance sheets. We think that the impact of tighter policy will eventually be felt in the broader economy, but if data continues to come in stronger and more resilient, the likelihood of recession will be pushed out further in the future. This could mean that recession is a story for 2024 instead of 2023.
This outcome of course has implications for the Fed and asset markets, but we’ll save that for next week.
Top Points of the Week

- Equities Trip: After a resilient start to the week, global equities stumbled the last two days of the week, pressured by higher bond yields which rose in response to elevated inflation readings and stepped-up hawkishness from Federal Reserve speakers. Interestingly the NASDAQ and Russell 1000 Growth stocks performed the best on the week, despite the surge in rates (higher growth, high valuation stocks have typically been more sensitive to changes in interest rates).
- Bond Yields Surge: In response to strong economic data (retail sales), continued elevated inflation data (CPI, PPI), and hawkish Fed speak, bond yields surged higher across the curve this week. Effectively, recent data supports a “higher for longer” policy stance by the Fed, meaning the dovish bond market bets (that the Fed would hike less than their guidance and would quickly pivot to cutting rates) are now being unwound. The biggest jump was in the short end (2-year Treasury), which reflects a higher for longer policy rate. Long yields also rose with stronger growth and inflation data. Globally, 2-year yields are making new cycle highs in many countries (Germany, Canada, Spain, Mexico, and more), reflecting higher for longer policy, growth, and inflation.
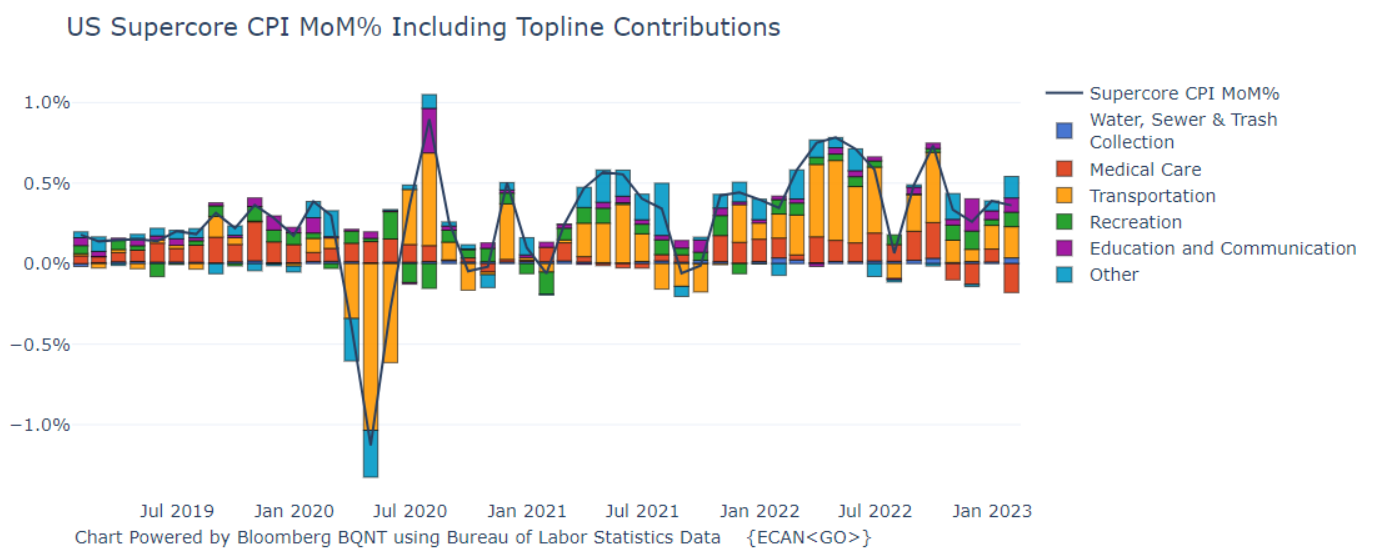
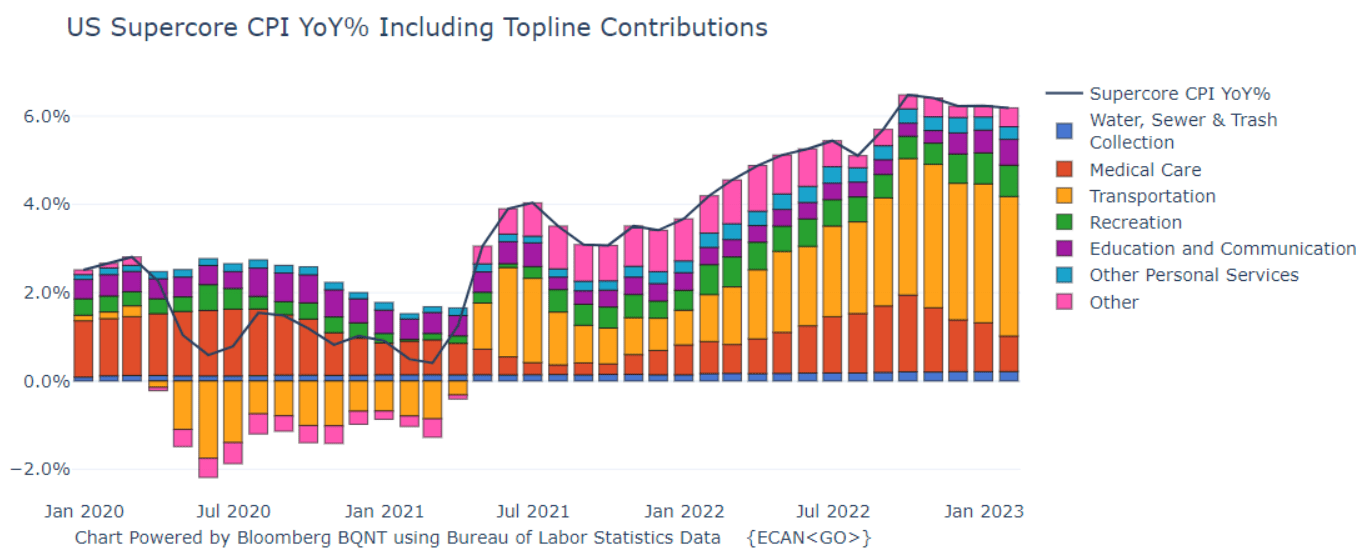
- CPI Back in the Game: January’s Consumer Price Index was in-line with expectations on a month-over-month (MoM) basis (Headline +0.5%, Core +0.4%), but importantly these monthly figures showed a reacceleration in inflation vs. December’s readings, which were revised higher (December Headline +0.1%, Core +0.4%). The source of this reacceleration was mainly due to higher energy prices (as we previewed here), while ~50% of the MoM increase came from Shelter. However, looking at the Fed’s new favorite metric “Super Core CPI” (Core Services ex Shelter), even removing this Shelter impact, inflation remains elevated (+6.2%) and only moderated slightly MoM (+0.36%). Super Core charts shown below.
- PPI Hot, Hot, Heat: January’s Producer Price Index came in higher than expectations and with a notable reacceleration from December’s readings, which were revised higher (MoM PPI Final Demand +0.7% vs. +0.4% consensus and -0.2% prior; PPI ex food, energy, trade +0.6% vs. +0.2% consensus and +0.2% prior). The source of the reacceleration was broad-based, with higher readings in Energy, Goods, Services, and Construction. This hot PPI data does not support a continuation of the Fed’s “disinflation” narrative (Powell said “disinflation” eleven times at the last press conference).
- Retail Sales Strong: Retail sales in the U.S. roared back in January after a soft December reading (+3% vs. +2% consensus and -1.1% prior). Some pointed to seasonal adjustments that could have skewed numbers. Others pointed out potential cracks in consumer credit. The New York Fed released its Quarterly Report on Household Debt and Credit, which showed credit card debt jumping back above pre-pandemic levels and delinquency rates now higher than they were in 2019.
- Jobs Still Tight, Continuing Claims Creeping Up: Another week, another downside surprise to initial jobless claims (194k vs. 200k consensus), which continue to come in well below recent years, including the tight jobs market of 2018 and 2019. We are starting to see a slight creeping higher of Continuing Jobless Claims (1.696M vs. 1.680M consensus), but these remain at the low end of the tight jobs market of 2018 and 2019.
- Hawks Take Flight: Following on the heels of strong growth and hot inflation data, Federal Reserve speakers stepped up their hawkish commentary about the future path for policy. On Thursday, regional Fed presidents Mester and Bullard both pointed to the potential for a step up to a 50 bps hike in March (after the downshift to 25 bps in January). The bond market finally started appreciating the “higher for longer” narrative from the Fed, pricing in a rising chance of a 50 bps hike in March, a 50/50 chance of a 25 bps hike in June, and only 20 bps of cuts in 2H23 (vs. 50 bps just three weeks ago).
- Earnings Season: 407 of the S&P 500’s names have now reported for the 4Q22 earnings season. 68% of companies have beaten on EPS and 57% have beaten on revenue. The aggregate beat on EPS is 1.89% and on revenue is 1.82%. All of these metrics are below longer run averages for both the percentage and degree of beats. In response to weaker earnings and soft guidance, analysts are cutting estimates for 2023, with a -1% decline to $220 now expected for the full year (vs. +9% growth expected 6 months ago, Bloomberg Consensus).
- YOLO is Back: The option market was back in focus this week as a key driver of market action year to date. In an informative interview with Bloomberg Television, Peter Tchir described how gambling-like, ultra-short-dated option trading has become a major market driver, similar to late 2020 and early 2021, when retail investors poured into options in order to amplify upside exposure. This option activity has effectively magnified recent moves to the upside in individual stocks and indices. Interestingly, the inverse happened during Thursday’s late-afternoon swoon, when short-dated put buying (bearish bets) contributed to a quick drop in prices (based on analysis by Bloomberg’s Cameron Crise).
- Coming Up Next Week: Next week’s key data point will be the January Personal Consumption Expenditures inflation data (consensus is for MoM Headline +0.5% and Core +0.4%, both showing a marked acceleration from December). PCE is the Fed’s preferred inflation measure. Other data includes regional manufacturing surveys, new home sales, an update to the University of Michigan Consumer Sentiment, and 4Q22 GDP revisions. The FOMC’s January meeting minutes will be released and the parade of Fed speakers will continue with speeches from Mester, Waller, Collins, Daly, and Bostic. Earnings season will continue with 65 S&P 500 names reporting including DE, NVDA, HD, and EOG.
Supercore CPI Charts from Bloomberg’s ECAN Function (as of 2/17/23)
Supercore CPI is defined and Core Services (ex energy) ex Owner’s Equivalent Rent and Rent of Primary Residence

1. The Kansas City Fed released a paper recently arguing for a shorter lag since 2009 of monetary policy’s impact on inflation, but they noted that the lag of policy on unemployment has not shortened. https://www.kansascityfed.org/research/economic-bulletin/have-lags-in-monetary-policy-transmission-shortened/
IMPORTANT DISCLOSURES
Abbreviations: 10 2 spread: 10-2 Year Treasury Yield Spread; EPS: Earnings per Share; Fed speak: refers to speeches about monetary policy given by members of the U.S. Federal Reserve Board of Governors. PCE: personal consumption expenditures; ZIRP: zero interest-rate policy; GFC: global financial crisis; CPI: Consumer Price Index; PPI: Producer Price Index; Powell: Jerome Powell, Chair of the Board of Governors of the Federal Reserve System; Bullard: James Bullard, President of the Federal Reserve Bank of St. Louis; Mester: Loretta Mester, President of the Federal Reserve Bank of Cleveland; FOMC: Federal Open Market Committee; Bostic: Raphael Bostic, President of the Federal Reserve Bank of Atlanta; Waller: Christopher Waller, member of the Federal Reserve Board of Governors; Collins: Susan Collins, President of the Federal Reserve Bank of Boston; Daly: Mary Daly, President of the Federal Reserve Bank of San Francisco; Bostic
Index Information: All returns represent total return for stated period. S&P 500 is a total return index that reflects both changes in the prices of stocks in the S&P 500 Index as well as the reinvestment of the dividend income from its underlying stocks. Dow Jones Industrial Average (DJ Industrial Average) is a price-weighted average of 30 actively traded blue-chip stocks trading New York Stock Exchange and Nasdaq. The NASDAQ Composite Index measures all NASDAQ domestic and international based common type stocks listed on the Nasdaq Stock Market. Russell 2000 is an index that measures the performance of the small-cap segment of the U.S. equity universe. MSCI International Developed measures equity market performance of large, developed markets not including the U.S. MSCI Emerging Markets (MSCI Emerging Mkts) measures equity market performance of emerging markets. Russell 1000 Growth Index measures the performance of the large- cap growth segment of the US equity universe. It includes those Russell 1000 companies with relatively higher price-to-book ratios, higher I/B/E/S forecast medium term (2 year) growth and higher sales per share historical growth (5 years). The Russell 1000 Value Index measures the performance of the large cap value segment of the US equity universe. It includes those Russell 1000 companies with relatively lower price-to-book ratios, lower I/B/E/S forecast medium term (2 year) growth and lower sales per share historical growth (5 years). The “BBB IG Spread” is the Bloomberg Baa Corporate Index that measures the spread of BBB/Baa U.S. corporate bond yields over Treasuries. The HY OAS is the High Yield Option Adjusted Spread index measuring the spread of high yield bonds over Treasuries. The Empire Fed Manufacturing Survey is a monthly survey of manufacturers in New York State conducted by the Federal Reserve Bank of New York with readings above 50 signaling expansion and below 50 contraction.
The views and opinions included in these materials belong to their author and do not necessarily reflect the views and opinions of NewEdge Capital Group, LLC.
This information is general in nature and has been prepared solely for informational and educational purposes and does not constitute an offer or a recommendation to buy or sell any particular security or to adopt any specific investment strategy.
NewEdge and its affiliates do not render advice on legal, tax and/or tax accounting matters. You should consult your personal tax and/or legal advisor to learn about any potential tax or other implications that may result from acting on a particular recommendation.
The trademarks and service marks contained herein are the property of their respective owners. Unless otherwise specifically indicated, all information with respect to any third party not affiliated with NewEdge has been provided by, and is the sole responsibility of, such third party and has not been independently verified by NewEdge, its affiliates or any other independent third party. No representation is given with respect to its accuracy or completeness, and such information and opinions may change without notice.
Investing involves risk, including possible loss of principal. Past performance is no guarantee of future results.
Any forward-looking statements or forecasts are based on assumptions and actual results are expected to vary from any such statements or forecasts. No assurance can be given that investment objectives or target returns will be achieved. Future returns may be higher or lower than the estimates presented herein.
An investment cannot be made directly in an index. Indices are unmanaged and have no fees or expenses. You can obtain information about many indices online at a variety of sources including: https://www.sec.gov/answers/indices.htm.
All data is subject to change without notice.
© 2026 NewEdge Capital Group, LLC
Note: This piece is not about friendly adolescent dinosaurs going on a Hero’s Journey, but it is a great pun to talk about the limitations of recent debates about economic “landings”.
In the span of just two months, the dominant market narrative has shifted from hard landing, to soft landing, to no landing. Markets have gone from expecting an imminent recession, to expecting immaculate disinflation (a rapid deceleration in inflation at no expense to growth), to expecting a continuation of resilient growth and elevated inflation.
This evolution of the landing debate, and this week’s robust economic data, has led many to ask the question: how can the economy be so resilient after the Fed has tightened policy so meaningfully?
We think there are two key, interrelated factors that drive the answer to this question: time and short-term rate sensitivity after a decade of ZIRP. Hence, “no land before time”.
First, this resilience in the U.S. economy could simply be a function of time. The Fed points to the “long and variable lags” of how monetary policy impacts economic activity (i.e., jobs) and statistics (i.e., inflation)[1]. This essentially means that the Fed’s tightening of policy does not immediately impact the real economy.
As we have experienced in past cycles and certainly in 2022 and 2023, it is financial markets and interest rate sensitive sectors, such as housing and autos, that get hit first by the Fed’s projected and actual policy tightening. It can then take years for this weakness to spread and result in broad economic malaise.
For example, prior to the Great Financial Crisis, the Fed started hiking rates in 2004 but unemployment didn’t begin rising significantly until late 2007. In fact, unemployment did not start rising until a year after the Fed paused its rate hikes.
But even within interest rate sensitive sectors, like housing, there can be significant lags in real activity/data. Housing sentiment (National Association of Home Builders Market Index) peaked in June 2005, about one year after the Fed started raising rates, but housing construction employment didn’t peak until April of 2006.
So this leads us to argue for “No Land Before Time”, meaning the character of the “landing” (soft or hard) post the Fed hikes will take time to develop, and that strong/resilient data in the short-term does not rule out the eventual impact of higher rates in the future.
The second rationale for recent sturdiness in data may serve to extend this time factor further. There is an argument that, after a decade of aggressive Fed intervention, ultra-loose liquidity, and zero interest rate policy, the U.S. economy is less immediately sensitive to short-term interest rates than it was in prior cycles, despite higher overall debt levels.
Many corporate and consumer borrowers used the decade-plus of ultra-low interest rates to borrow at very low rates at longer maturities, effectively reducing their sensitivity to short-term rate increases.
One example of this is with consumer mortgages. Going into the GFC, adjustable-rate mortgages reached a peak of 35% of total mortgage volumes. When the Fed started raising rates in 2004, many homeowners were priced out of their existing mortgages, which caused foreclosures and forced sales that contributed to sharp housing price weakness.
In contrast, at the beginning of 2022’s hiking cycle, only 5% of mortgages were floating rates, so as rates rose, the vast majority of borrowers were impervious to the jump in rates. Of course, higher rates have impacted housing activity, as new buyers and home switchers face much higher mortgage costs, but the degree of housing pain has been dampened by the dominance of fixed borrowing at historically low rates.
A similar story can be told in the corporate sector, where companies have used the last decade of ultra-low long-dated rates to reduce their reliance on short-term borrowing.
We can see this by looking at Commercial Paper volumes. Commercial Paper is very short-term borrowing that is often used by companies to fund short-term needs, like working capital.
Commercial Paper and other short-term borrowing were also at the heart of many of the corporate implosions of the early 2000’s recession and GFC. Many remember the story of ENRON as an accounting scandal of fraudulent earnings, but what revealed this malfeasance was the company’s reliance on short-term borrowing to fund long-term investments. As the Fed hiked rates in the late 2000s, ENRON’s funding costs ballooned and eventually led to its downfall.
However, since the GFC, very low long-term interest rates have allowed companies to significantly reduce their reliance on short-term funding, like Commercial Paper, effectively making their balance sheets less sensitive to Fed policy tightening.
Overall, balance sheets that have longer term borrowing do not have to refinance as often, meaning they are less impacted by short-term interest rate increases. Of course, refinances eventually occur, so the pinch from high interest rates will eventually be felt, but more delayed compared to balance sheets that are shorter term.
Putting it all together, we see reason for U.S. economic growth to remain more resilient than current consensus forecasts (Bloomberg still has a 65% probability of recession in the next twelve months) because of these factors of time lags and longer-term balance sheets. We think that the impact of tighter policy will eventually be felt in the broader economy, but if data continues to come in stronger and more resilient, the likelihood of recession will be pushed out further in the future. This could mean that recession is a story for 2024 instead of 2023.
This outcome of course has implications for the Fed and asset markets, but we’ll save that for next week.
Top Points of the Week
- Equities Trip: After a resilient start to the week, global equities stumbled the last two days of the week, pressured by higher bond yields which rose in response to elevated inflation readings and stepped-up hawkishness from Federal Reserve speakers. Interestingly the NASDAQ and Russell 1000 Growth stocks performed the best on the week, despite the surge in rates (higher growth, high valuation stocks have typically been more sensitive to changes in interest rates).
- Bond Yields Surge: In response to strong economic data (retail sales), continued elevated inflation data (CPI, PPI), and hawkish Fed speak, bond yields surged higher across the curve this week. Effectively, recent data supports a “higher for longer” policy stance by the Fed, meaning the dovish bond market bets (that the Fed would hike less than their guidance and would quickly pivot to cutting rates) are now being unwound. The biggest jump was in the short end (2-year Treasury), which reflects a higher for longer policy rate. Long yields also rose with stronger growth and inflation data. Globally, 2-year yields are making new cycle highs in many countries (Germany, Canada, Spain, Mexico, and more), reflecting higher for longer policy, growth, and inflation.
- CPI Back in the Game: January’s Consumer Price Index was in-line with expectations on a month-over-month (MoM) basis (Headline +0.5%, Core +0.4%), but importantly these monthly figures showed a reacceleration in inflation vs. December’s readings, which were revised higher (December Headline +0.1%, Core +0.4%). The source of this reacceleration was mainly due to higher energy prices (as we previewed here), while ~50% of the MoM increase came from Shelter. However, looking at the Fed’s new favorite metric “Super Core CPI” (Core Services ex Shelter), even removing this Shelter impact, inflation remains elevated (+6.2%) and only moderated slightly MoM (+0.36%). Super Core charts shown below.
- PPI Hot, Hot, Heat: January’s Producer Price Index came in higher than expectations and with a notable reacceleration from December’s readings, which were revised higher (MoM PPI Final Demand +0.7% vs. +0.4% consensus and -0.2% prior; PPI ex food, energy, trade +0.6% vs. +0.2% consensus and +0.2% prior). The source of the reacceleration was broad-based, with higher readings in Energy, Goods, Services, and Construction. This hot PPI data does not support a continuation of the Fed’s “disinflation” narrative (Powell said “disinflation” eleven times at the last press conference).
- Retail Sales Strong: Retail sales in the U.S. roared back in January after a soft December reading (+3% vs. +2% consensus and -1.1% prior). Some pointed to seasonal adjustments that could have skewed numbers. Others pointed out potential cracks in consumer credit. The New York Fed released its Quarterly Report on Household Debt and Credit, which showed credit card debt jumping back above pre-pandemic levels and delinquency rates now higher than they were in 2019.
- Jobs Still Tight, Continuing Claims Creeping Up: Another week, another downside surprise to initial jobless claims (194k vs. 200k consensus), which continue to come in well below recent years, including the tight jobs market of 2018 and 2019. We are starting to see a slight creeping higher of Continuing Jobless Claims (1.696M vs. 1.680M consensus), but these remain at the low end of the tight jobs market of 2018 and 2019.
- Hawks Take Flight: Following on the heels of strong growth and hot inflation data, Federal Reserve speakers stepped up their hawkish commentary about the future path for policy. On Thursday, regional Fed presidents Mester and Bullard both pointed to the potential for a step up to a 50 bps hike in March (after the downshift to 25 bps in January). The bond market finally started appreciating the “higher for longer” narrative from the Fed, pricing in a rising chance of a 50 bps hike in March, a 50/50 chance of a 25 bps hike in June, and only 20 bps of cuts in 2H23 (vs. 50 bps just three weeks ago).
- Earnings Season: 407 of the S&P 500’s names have now reported for the 4Q22 earnings season. 68% of companies have beaten on EPS and 57% have beaten on revenue. The aggregate beat on EPS is 1.89% and on revenue is 1.82%. All of these metrics are below longer run averages for both the percentage and degree of beats. In response to weaker earnings and soft guidance, analysts are cutting estimates for 2023, with a -1% decline to $220 now expected for the full year (vs. +9% growth expected 6 months ago, Bloomberg Consensus).
- YOLO is Back: The option market was back in focus this week as a key driver of market action year to date. In an informative interview with Bloomberg Television, Peter Tchir described how gambling-like, ultra-short-dated option trading has become a major market driver, similar to late 2020 and early 2021, when retail investors poured into options in order to amplify upside exposure. This option activity has effectively magnified recent moves to the upside in individual stocks and indices. Interestingly, the inverse happened during Thursday’s late-afternoon swoon, when short-dated put buying (bearish bets) contributed to a quick drop in prices (based on analysis by Bloomberg’s Cameron Crise).
- Coming Up Next Week: Next week’s key data point will be the January Personal Consumption Expenditures inflation data (consensus is for MoM Headline +0.5% and Core +0.4%, both showing a marked acceleration from December). PCE is the Fed’s preferred inflation measure. Other data includes regional manufacturing surveys, new home sales, an update to the University of Michigan Consumer Sentiment, and 4Q22 GDP revisions. The FOMC’s January meeting minutes will be released and the parade of Fed speakers will continue with speeches from Mester, Waller, Collins, Daly, and Bostic. Earnings season will continue with 65 S&P 500 names reporting including DE, NVDA, HD, and EOG.
Supercore CPI Charts from Bloomberg’s ECAN Function (as of 2/17/23)
Supercore CPI is defined and Core Services (ex energy) ex Owner’s Equivalent Rent and Rent of Primary Residence
1. The Kansas City Fed released a paper recently arguing for a shorter lag since 2009 of monetary policy’s impact on inflation, but they noted that the lag of policy on unemployment has not shortened. https://www.kansascityfed.org/research/economic-bulletin/have-lags-in-monetary-policy-transmission-shortened/
IMPORTANT DISCLOSURES
Abbreviations: 10 2 spread: 10-2 Year Treasury Yield Spread; EPS: Earnings per Share; Fed speak: refers to speeches about monetary policy given by members of the U.S. Federal Reserve Board of Governors. PCE: personal consumption expenditures; ZIRP: zero interest-rate policy; GFC: global financial crisis; CPI: Consumer Price Index; PPI: Producer Price Index; Powell: Jerome Powell, Chair of the Board of Governors of the Federal Reserve System; Bullard: James Bullard, President of the Federal Reserve Bank of St. Louis; Mester: Loretta Mester, President of the Federal Reserve Bank of Cleveland; FOMC: Federal Open Market Committee; Bostic: Raphael Bostic, President of the Federal Reserve Bank of Atlanta; Waller: Christopher Waller, member of the Federal Reserve Board of Governors; Collins: Susan Collins, President of the Federal Reserve Bank of Boston; Daly: Mary Daly, President of the Federal Reserve Bank of San Francisco; Bostic
Index Information: All returns represent total return for stated period. S&P 500 is a total return index that reflects both changes in the prices of stocks in the S&P 500 Index as well as the reinvestment of the dividend income from its underlying stocks. Dow Jones Industrial Average (DJ Industrial Average) is a price-weighted average of 30 actively traded blue-chip stocks trading New York Stock Exchange and Nasdaq. The NASDAQ Composite Index measures all NASDAQ domestic and international based common type stocks listed on the Nasdaq Stock Market. Russell 2000 is an index that measures the performance of the small-cap segment of the U.S. equity universe. MSCI International Developed measures equity market performance of large, developed markets not including the U.S. MSCI Emerging Markets (MSCI Emerging Mkts) measures equity market performance of emerging markets. Russell 1000 Growth Index measures the performance of the large- cap growth segment of the US equity universe. It includes those Russell 1000 companies with relatively higher price-to-book ratios, higher I/B/E/S forecast medium term (2 year) growth and higher sales per share historical growth (5 years). The Russell 1000 Value Index measures the performance of the large cap value segment of the US equity universe. It includes those Russell 1000 companies with relatively lower price-to-book ratios, lower I/B/E/S forecast medium term (2 year) growth and lower sales per share historical growth (5 years). The “BBB IG Spread” is the Bloomberg Baa Corporate Index that measures the spread of BBB/Baa U.S. corporate bond yields over Treasuries. The HY OAS is the High Yield Option Adjusted Spread index measuring the spread of high yield bonds over Treasuries. The Empire Fed Manufacturing Survey is a monthly survey of manufacturers in New York State conducted by the Federal Reserve Bank of New York with readings above 50 signaling expansion and below 50 contraction.
The views and opinions included in these materials belong to their author and do not necessarily reflect the views and opinions of NewEdge Capital Group, LLC.
This information is general in nature and has been prepared solely for informational and educational purposes and does not constitute an offer or a recommendation to buy or sell any particular security or to adopt any specific investment strategy.
NewEdge and its affiliates do not render advice on legal, tax and/or tax accounting matters. You should consult your personal tax and/or legal advisor to learn about any potential tax or other implications that may result from acting on a particular recommendation.
The trademarks and service marks contained herein are the property of their respective owners. Unless otherwise specifically indicated, all information with respect to any third party not affiliated with NewEdge has been provided by, and is the sole responsibility of, such third party and has not been independently verified by NewEdge, its affiliates or any other independent third party. No representation is given with respect to its accuracy or completeness, and such information and opinions may change without notice.
Investing involves risk, including possible loss of principal. Past performance is no guarantee of future results.
Any forward-looking statements or forecasts are based on assumptions and actual results are expected to vary from any such statements or forecasts. No assurance can be given that investment objectives or target returns will be achieved. Future returns may be higher or lower than the estimates presented herein.
An investment cannot be made directly in an index. Indices are unmanaged and have no fees or expenses. You can obtain information about many indices online at a variety of sources including: https://www.sec.gov/answers/indices.htm.
All data is subject to change without notice.
© 2026 NewEdge Capital Group, LLC
