


We didn’t start the fire
No, we didn’t light it, but we tried to fight it
“We Didn’t Start the Fire”, Billy Joel
Though Billy Joel recently released his first new song in 17 years, we’re partial to his old stuff, and apparently so is the Fed.
This week, Minneapolis Fed President Neel Kashkari published an essay titled “Policy Has Tightened a Lot. How Tight Is It?”, but we think a great alternative title would be “We Didn’t Stop the Fire”, the inflation fire that is.
In the essay, Kashkari raises the question about how much of the last 18 months of disinflation was in fact due to tighter Fed policy, versus the exogenous dynamics of improving supply chains post-pandemic. This question is raised in the context of real economic growth that has remained resilient and surprised forecasters to the upside (look at Atlanta Fed GDP Now running at 3.4% for 1Q24!), despite higher rates/tighter policy.
He notes that the Fed did play an important role in keeping inflation expectations anchored, but given the resilience in activity in economic data, even in classically interest-rate-sensitive sectors like housing construction, he posits a loaded question:
“These data lead me to question how much downward pressure monetary policy is currently placing on demand.”
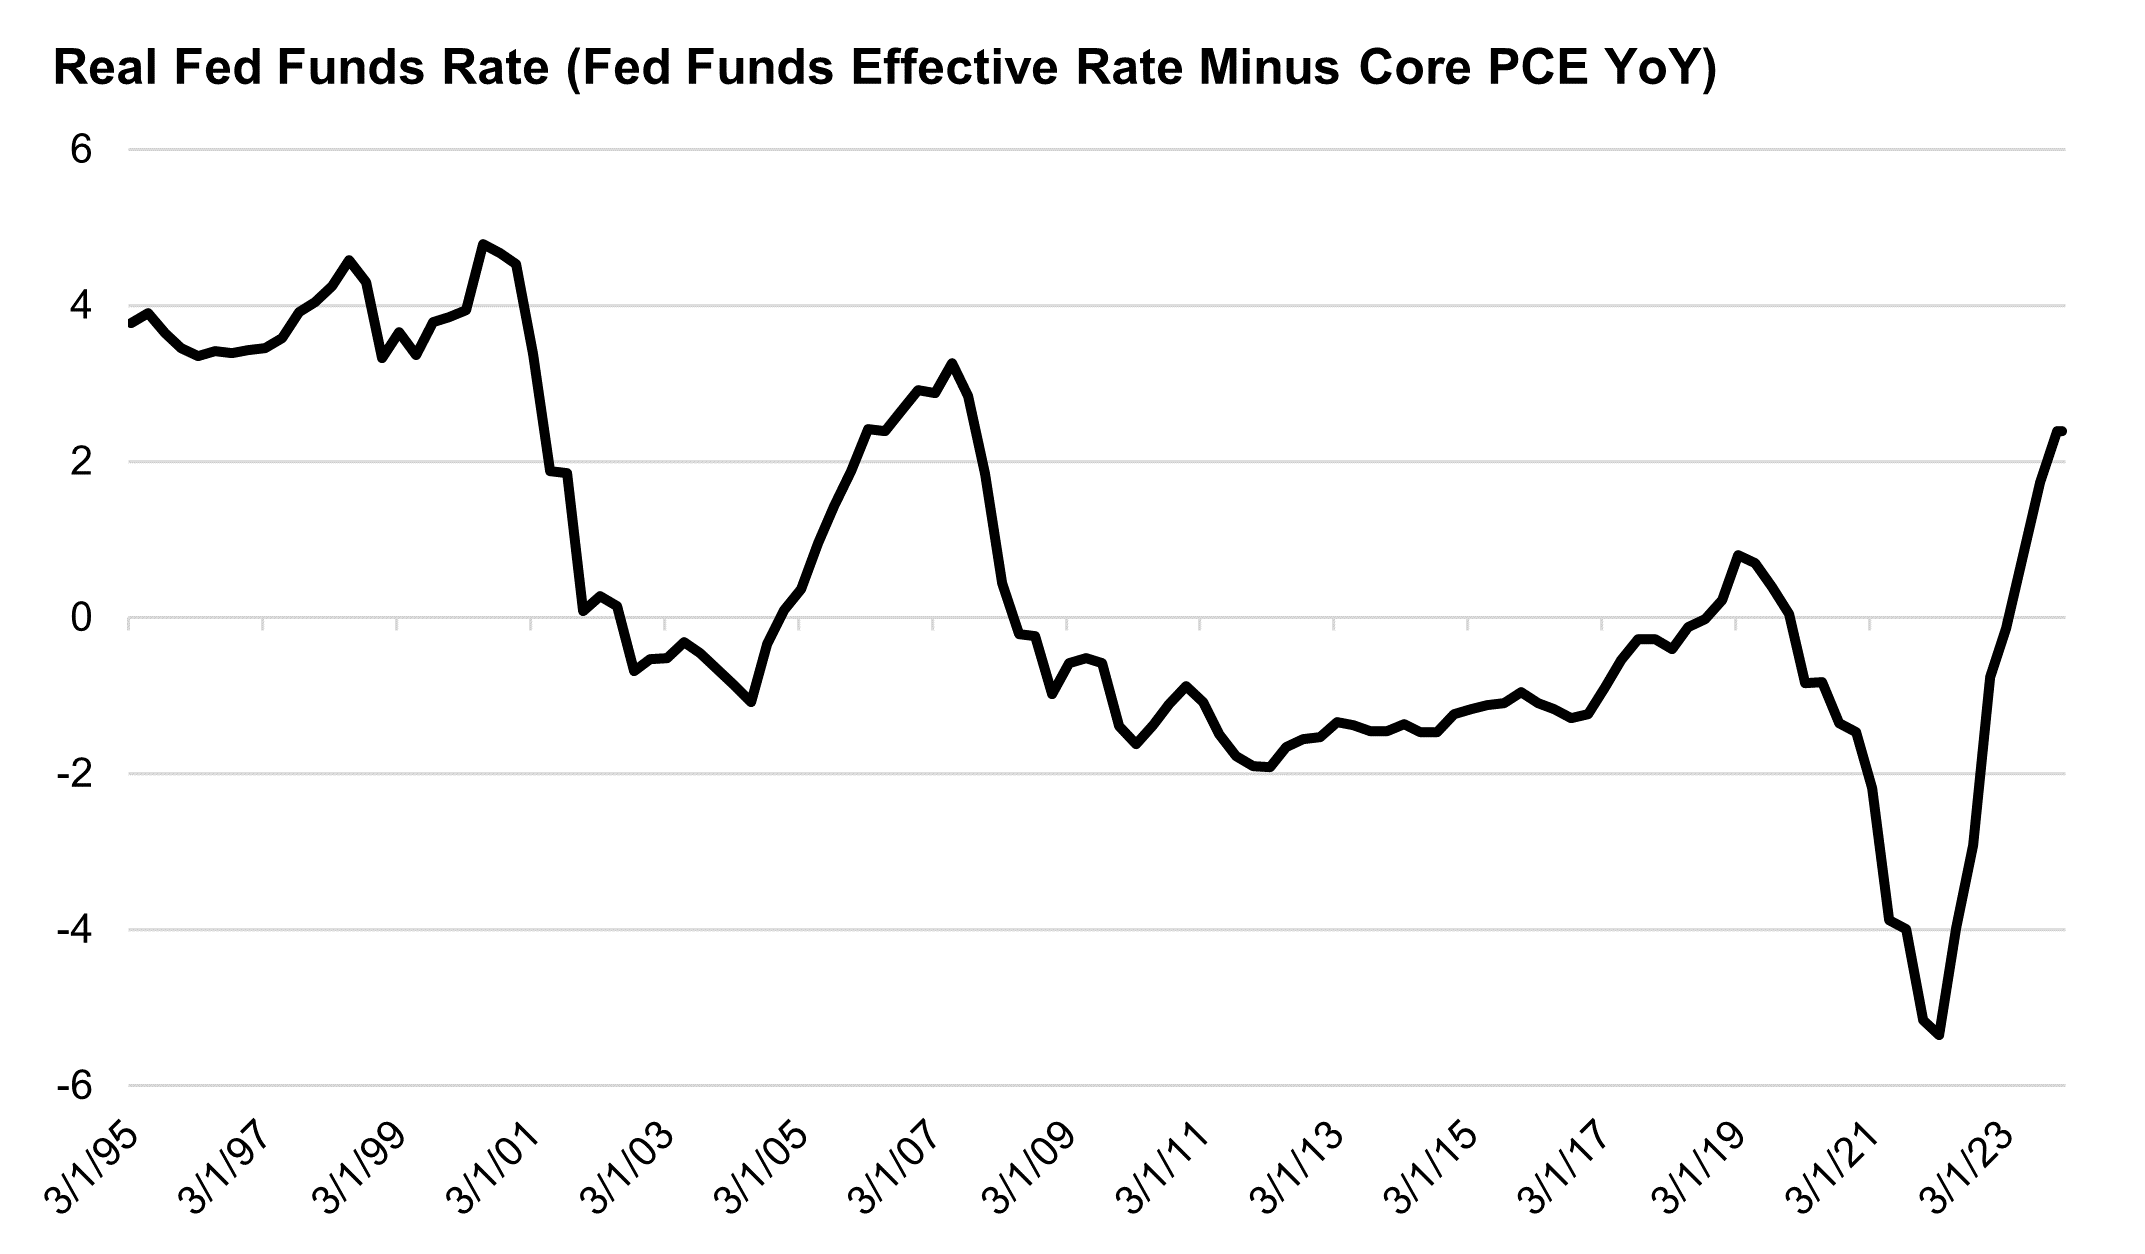
Exactly! To put a glaring point to it: the U.S. economy has been growing substantially above trend ever since the real Fed Funds rate (Fed Funds minus the Core PCE) turned positive in late 2Q23, implying there is not much evidence to suggest that “tight policy” is impacting broad economic growth (yet).
This resilient growth dynamic is one we have been writing extensively about over the past year (February 2023, July 2023, November 2023, 2024 Outlook). We have been arguing that higher rates have had a dulled and dampened impact this hiking cycle because of the prior cycle’s aggressive policy to lower long-term interest rates. This allowed corporations and households to access cheap, long-term debt and reduce their utilization of short-term/floating rate debt.
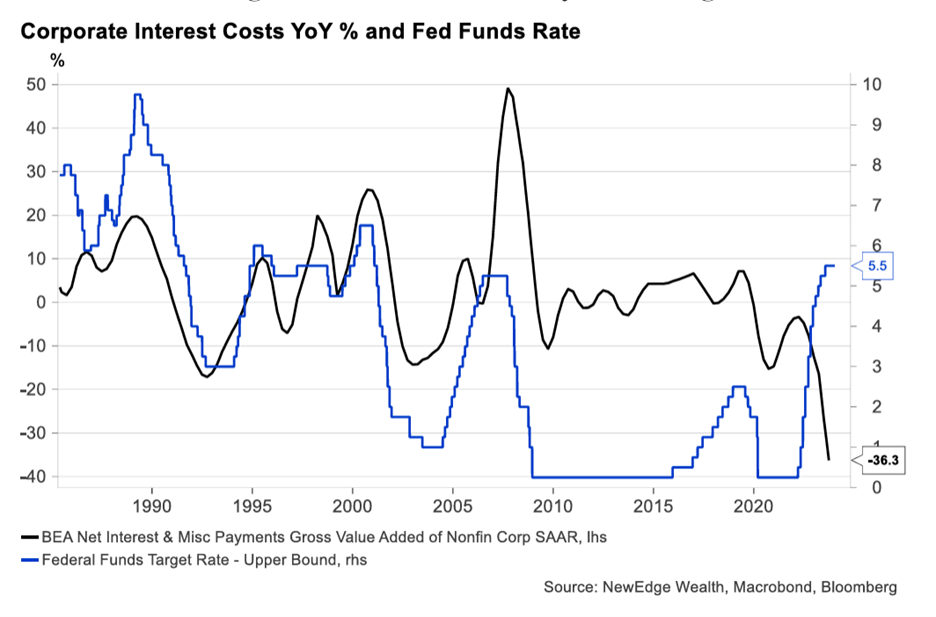
The starkest expression of this is the Bureau of Economic Analysis’ Net Interest Expense calculation being down 36% YoY in its latest reading. This (arguably stimulative) drop is thanks to higher interest income without a large jump in interest expense, marking the first time this measured dropped during a Fed hiking cycle!
We think this termed-out balance sheet dynamic is one key reason why the U.S. economy has been so strong in the face of higher rates (another reason is fiscal support), while other economies with more short-term interest rate exposure, such as Europe, have seen marked deterioration in growth has rates have risen.
Kashkari concludes the essay by saying:
“It is possible, at least during the post-pandemic recovery period, that the policy stance that represents neutral has increased. The implication of this is that, I believe, it gives the FOMC time to assess upcoming economic data before starting to lower the federal funds rate, with less risk that too-tight policy is going to derail the economic recovery.”
If this view is shared by other Fed members, it could have important implications for markets.
This statement suggests less urgency by the Fed to change policy as long as growth remains resilient, even as inflation falls. Effectively this is a “if it ain’t broke, don’t fix it” statement, implying that holding policy “as is” poses a lesser risk than easing policy and potentially sparking higher growth and inflation.
Of course, growth in and of itself is not a bad thing (as Fed Chair Powell outlined in his recent 60 Minutes interview), but if better growth were to be accompanied by a reacceleration in inflation, the Fed would not be pleased (as described in Richmond Fed President Barkin’s Bloomberg interview this week). The challenge is we, the Fed and markets collectively, simply do not know if inflation would come with better growth. It did not in 2023 (growth was substantially above trend, all the while inflation moderated), but the Fed seems hesitant to extrapolate that experience into the future. They certainly don’t want to restart the fire.
We think it is important to note in this context that there are signs of a nascent cyclical recovery brewing in the U.S., with both Manufacturing and Services Purchasing Managers Indices (PMIs) showing signs of early recovery, meaning if the Fed were to cut rates in 1H24, they would potentially be doing so into an accelerating PMI environment.
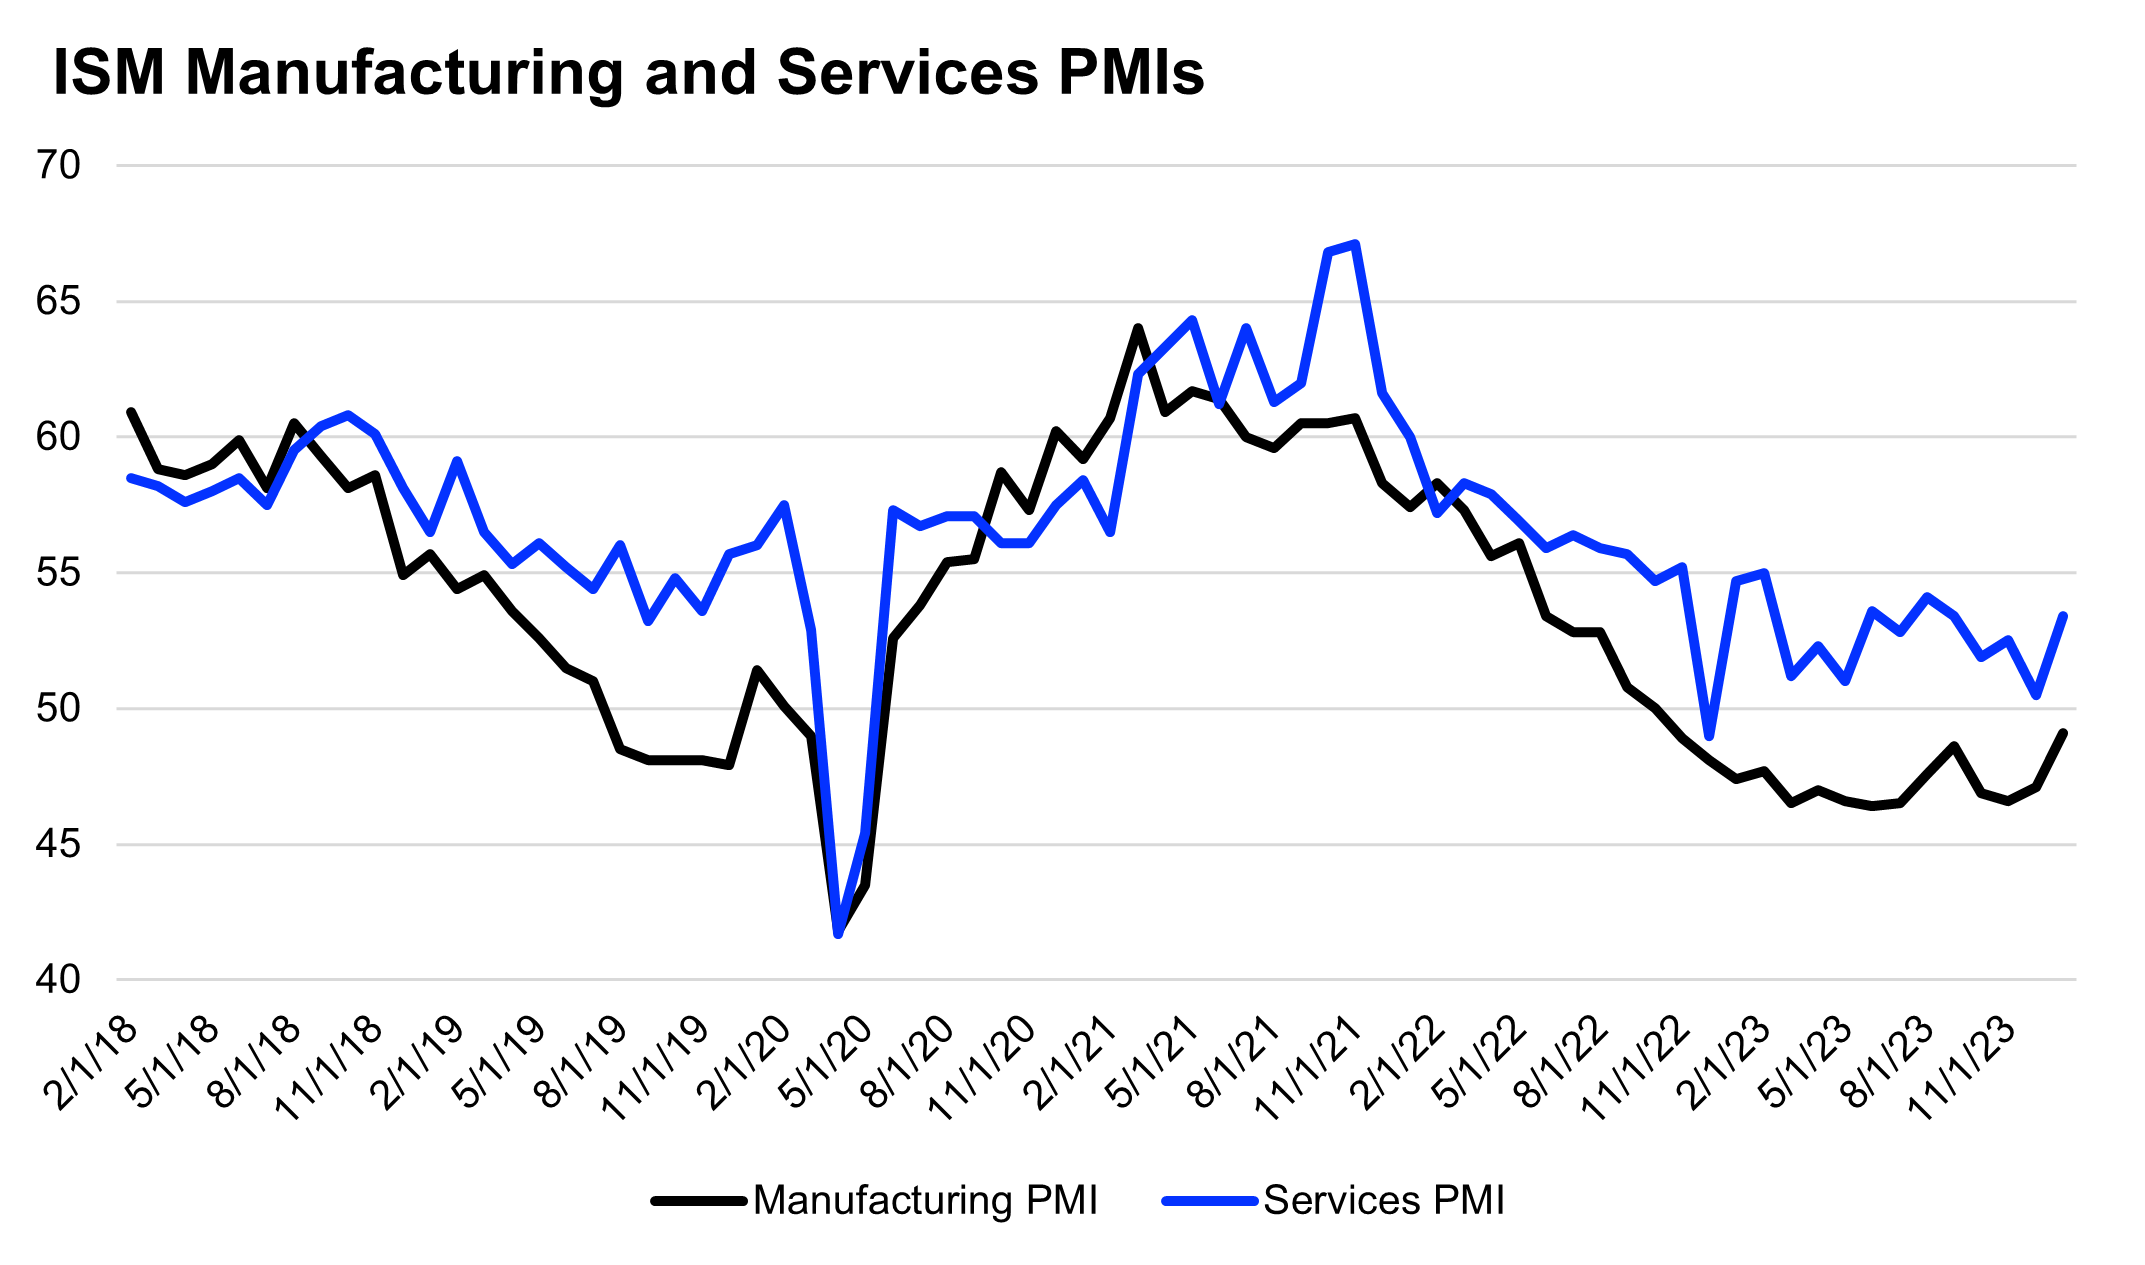
Looking back at past rate cutting cycles, this actually has never happened! Every rate cutting cycle since the early 1980’s began when the ISM Manufacturing PMI was already falling, even the non-recessionary cutting cycles of 1995, 1998, and 2019.
As we wrote back in November, recession fears have played an important role in every rate cutting cycle, whether they ended in recession or not, as the Fed moved to get ahead of potential/feared weakness. Without recession fears, but instead signs of cyclical recovery, the Fed may have less urgency to change policy.
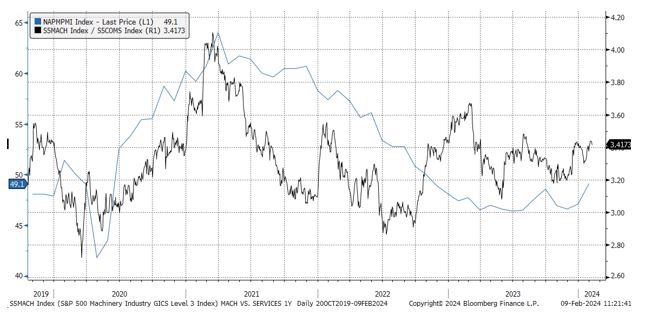
Note, this cyclical recovery is also endorsed by equity market leadership as shown by ratios of Machinery vs. Services stocks and Consumer Discretionary vs. Consumer Staples.
S&P 500 Machinery (Cyclical) vs. Industrial Services (Defensive) and ISM Manufacturing PMI
Equal Weight Consumer Discretionary (Cyclical) vs. Consumer Staples (Defensive) and Bloomberg Forecasts for Household Consumption in GDP

The market implications for all of this are similar to what we wrote about last week:
- Better data keeps the Fed patient and pushes bond markets to continue to price out the aggressive cuts it had projected for 2024.
- Fewer Fed cuts keeps a floor under and/or upward pressure on yields.
- The better economic data helps to keep credit spreads contained and should support equity earnings estimates (though EPS estimates continue to get cut for the average stock!).
- High equity valuations could get challenged by the pricing of a tighter Fed, but equities have been consistently been able to shrug this off in 2023 and to start 2024. Factors like momentum, positioning chases, and increased optimism have been superseding any headwind from higher valuations in the short run (valuation tends to be a poor timing tool for short term equity returns anyways). Liquidity is an important watch item for valuations, as it has expanded to start 2024 (using a proxy like bank reserves), which has likely been supportive of higher valuations. Tighter liquidity, if it materializes, would be a key challenge for heady valuations.
Top Points of the Week
By Austin Capasso and Ben Lope
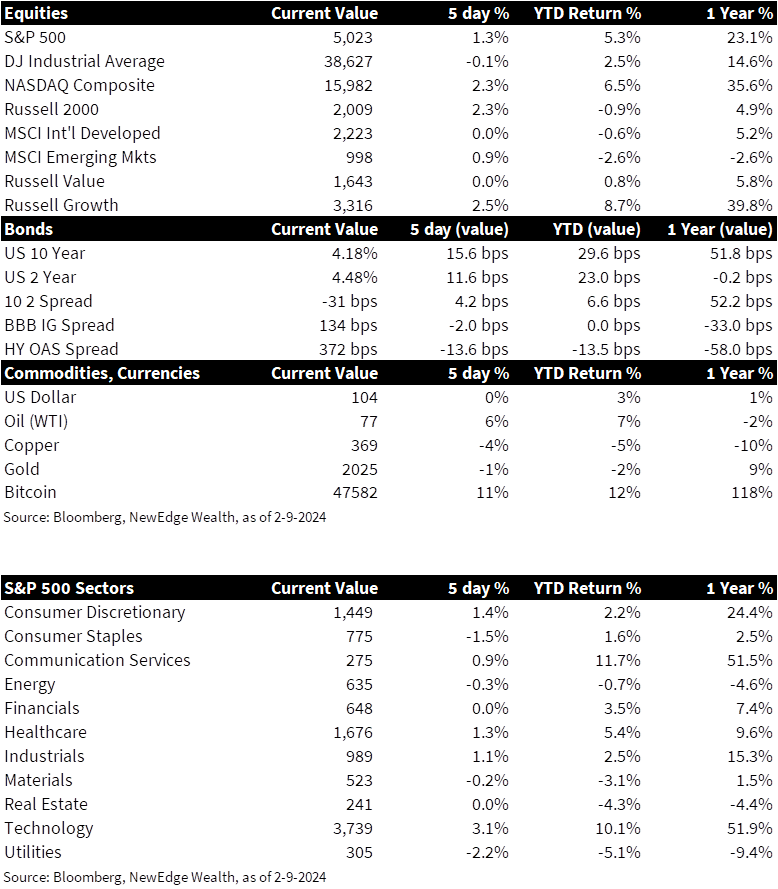
1. Equities – US equity indices were mostly higher on the week, with the major headline being that the S&P 500 surpassed 5,000. Growth stocks far outpaced value stocks, with the weekly gains of the Russell 1000 Growth and Russell 1000 Value indices registering 2.5% and 0%, respectively. Developed market equities were largely unchanged while emerging market equities were up modestly.
2. Rates – The 2-10 year Treasury yield curve became slightly flatter on the week, as yields on 10 year bonds increased by more than yields on 2 year bonds. The yield curve remains inverted by approximately 30 basis points and has not been flat or upward sloping since late Q2 2022.
3. Commodities – Crude oil prices increased approximately 5% this week, with the price per barrel of Brent crude climbing over $80 for the first time this month. The weekly increase was largely attributed to an escalation in military engagements in the Middle East and Israel’s rejection to the terms of the most recent ceasefire proposal from Hamas.
4. Jerome Powell on 60 Minutes – Over the weekend, Federal Reserve Chair Jerome Powell sat down with 60 Minutes for an interview and again stated that the pace of interest rate cuts is likely to be slower than the market expects. Although Powell signaled rising confidence that inflation is moving sustainably down to 2%, the Fed wants “more confidence before [they] take that very important step of beginning to cut interest rates.” Other topics discussed during the interview were Powell’s continued optimism with respect to the US economy’s strength, as well as a reiteration that the Fed will not be swayed by political pressure in the run up to this year’s presidential election.
5. Initial Jobless Claims – Initial jobless claims, a weekly measurement for the number of Americans who filed for unemployment benefits, fell this week to 218,000 from a three-month high of 227,000 last week. The number of people collecting unemployment benefits in the U.S. dropped by 23,000 to 1.87 million, which indicates that people are finding jobs rather quickly. All in all, the US jobs market remains very tight, and we will be watching for any signs of deterioration.
6. CPI Revised Downward – The Consumer Price Index (CPI) Report in December saw a revision lower than what was initially thought, but the overall inflation revisions were a mixed bag. On a monthly basis, headline CPI increased 0.2% versus the 0.3% previously reported. Markets see this as a good sign that the Fed is getting closer to their inflation target, but this does not make the chances of an interest rate cut in March any higher.
7. NYCB Turmoil Persists – Fearsrelated to the health of commercial real estate and the regional banks that often finance lending in the space were sparked by an alarming earnings report from New York Community Bancorp (NYCB) last week and persisted this week. Shares of NYCB have lost more than half of their value since the earnings announcement, where management disclosed surprising losses on loans for office and apartment real estate.
8. China Inflation Comes in Lower Than Expected – China saw the largest drop since the global recession in 2009 on their Consumer Price Index (CPI), indicating weaker consumer demand and a struggling economy overall. Inflation in China has now entered into deflationary territory after lowering 0.8% on an annual basis, which also marks the fourth straight month of decline on CPI. Analysts reported it was largely due to seasonal factors attributed to the Lunar New Year.
9. Next Week’s Marquee Earnings Reports – Next week’s earnings announcements feature a plethora of companies that should give investors insight into the health of the US consumer, with companies like Coca-Cola, Airbnb, Hyatt Hotels, and Lyft. Other marquee names include Applied Materials, Cisco Systems, DraftKings, and Coinbase.
10. The Week Ahead – The widely anticipated US Consumer Price Index (CPI) report for January next week will make for a week of volatility. Median forecasts for the month call for an increase of 0.2% and 0.3% for headline and core components of CPI, respectively. Next week also brings retail sales and important insight into the demand and activity in the US housing market.
IMPORTANT DISCLOSURES
Abbreviations/Definitions: Brent blend: a blend of crude oil extracted from oilfields in the North Sea between the United Kingdom and Norway. It is an industry standard because it is “light,” meaning not overly dense, and “sweet,” meaning it’s low in sulfur content; Core PCE: personal consumption expenditures prices excluding food and energy prices; CPI: Consumer Price Index; EPS: earnings per share; FOMC: Federal Open Market Committee; ISM Manufacturing PMI: Institute for Supply Management Purchasing Managers Index; ISM Services PMI: The Institute of Supply Management (ISM) services PMI (formerly known as Non-Manufacturing Index) is an economic index based on surveys of more than 400 non-manufacturing (or services) firms’ purchasing and supply executives; PMI: Purchasing Managers’ Index; Real Fed Funds Rate: Fed Funds effective rate minus Core PCE.
Index Information: All returns represent total return for stated period. S&P 500 is a total return index that reflects both changes in the prices of stocks in the S&P 500 Index as well as the reinvestment of the dividend income from its underlying stocks. Dow Jones Industrial Average (DJ Industrial Average) is a price-weighted average of 30 actively traded blue-chip stocks trading New York Stock Exchange and Nasdaq. The NASDAQ Composite Index measures all NASDAQ domestic and international based common type stocks listed on the Nasdaq Stock Market. Russell 2000 is an index that measures the performance of the small-cap segment of the U.S. equity universe. MSCI International Developed measures equity market performance of large, developed markets not including the U.S. MSCI Emerging Markets (MSCI Emerging Mkts) measures equity market performance of emerging markets. Russell 1000 Growth Index measures the performance of the large- cap growth segment of the US equity universe. It includes those Russell 1000 companies with relatively higher price-to-book ratios, higher I/B/E/S forecast medium term (2 year) growth and higher sales per share historical growth (5 years). The Russell 1000 Value Index measures the performance of the large cap value segment of the US equity universe. It includes those Russell 1000 companies with relatively lower price-to-book ratios, lower I/B/E/S forecast medium term (2 year) growth and lower sales per share historical growth (5 years). The BBB IG Spread is the Bloomberg Baa Corporate Index that measures the spread of BBB/Baa U.S. corporate bond yields over Treasuries. The HY OAS is the High Yield Option Adjusted Spread index measuring the spread of high yield bonds over Treasuries. Atlanta Fed GDPNow index is a “nowcast” of real GDP growth based on available economic data for the current measured quarter.
Sector Returns: Sectors are based on the GICS methodology. Returns are cumulative total return for stated period, including reinvestment of dividends.
The views and opinions included in these materials belong to their author and do not necessarily reflect the views and opinions of NewEdge Capital Group, LLC.
This information is general in nature and has been prepared solely for informational and educational purposes and does not constitute an offer or a recommendation to buy or sell any particular security or to adopt any specific investment strategy.
NewEdge and its affiliates do not render advice on legal, tax and/or tax accounting matters. You should consult your personal tax and/or legal advisor to learn about any potential tax or other implications that may result from acting on a particular recommendation.
The trademarks and service marks contained herein are the property of their respective owners. Unless otherwise specifically indicated, all information with respect to any third party not affiliated with NewEdge has been provided by, and is the sole responsibility of, such third party and has not been independently verified by NewEdge, its affiliates or any other independent third party. No representation is given with respect to its accuracy or completeness, and such information and opinions may change without notice.
Investing involves risk, including possible loss of principal. Past performance is no guarantee of future results.
Any forward-looking statements or forecasts are based on assumptions and actual results are expected to vary from any such statements or forecasts. No assurance can be given that investment objectives or target returns will be achieved. Future returns may be higher or lower than the estimates presented herein.
An investment cannot be made directly in an index. Indices are unmanaged and have no fees or expenses. You can obtain information about many indices online at a variety of sources including: https://www.sec.gov/answers/indices.htm.
All data is subject to change without notice.
© 2026 NewEdge Capital Group, LLC

