


Words like violence
Break the silence
Come crashing in
Into my little world
“Enjoy the Silence”, Depeche Mode
Wasn’t that nice? A whole week without Fed speak! The board is in its “quiet period” in the lead up to next week’s meeting of the Federal Open Market Committee.
The “silence breaks” at Wednesday’s press conference, and here are three things we are watching/listening for as we assess how the Fed is approaching policy into 2024.
1. Watch the Dot Plot, and listen for the degree of pushback against the bond market’s rate-cut bets.
This December meeting provides an update to the Fed’s Dot Plot, the collective forecasts of individual Fed members about where they expect policy rates to be set in the coming years.
Though the Dot Plot should be taken with a grain of salt- it is often “wrong”, as the Fed’s rate forecast can changes materially as data changes. After all, at the start of 2022 the Fed only thought Fed Funds would reach 1.5% by the end 2023, a veritable mile from the current 5.5% rate! Regardless, it is a helpful tool to get a snapshot of the Fed’s current thinking about rates and the economy.
Federal Reserve September 2023 Dot Plot with Current Market Pricing
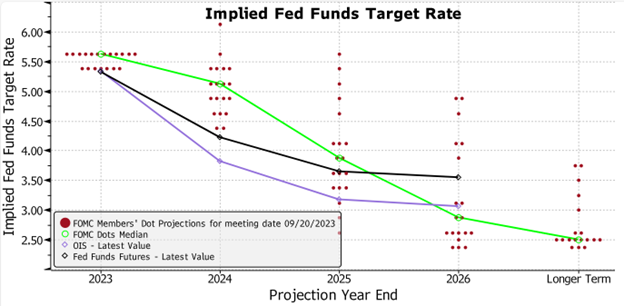
The chart above shows the September Dot Plot, which shows one more hike in 2023, two cuts in 2024 based on the median Dot, and a highly uncertain policy path in 2025 (as captured by the nearly 300 bps spread between the high and low dot for 2025).
We expect a few changes next week. First, the extra hike in 2023 is likely to be removed, given no hike is expected at this last meeting of the year. Second, we expect the ranges for 2024 and 2025 to narrow (making the median forecast mildly more useful as hawks and doves coalesce). This narrowing of the range could result in interesting new “median” dots for the coming years.
What we do not expect to hear or see next week is an outright endorsement of the bond market’s current expectations for rate cuts next year. Though the Fed has talked about tweaking rates lower in 2024 as long as inflation continues to moderate, it should be noted that the bond market is way ahead of the Fed in pricing in cuts for next year (yet again, for the seventh time this hiking cycle!). The current bond market pricing for 2024 of 120 bps cuts would result in a Fed Funds rate nearly 75 bps below the lowest, most dovish dot in the September plot.
Whether we look at the Dot Plot or listen to Powell’s press conference, we do not expect the Fed to endorse the degree of tightening that is currently being priced into markets. Of course, Powell attempted to push back against these cuts in a recent speech, but this pushback was seen as soft by markets (we were reminded of the scene in Willy Wonka & the Chocolate Factory where Gene Wilder lazily and sarcastically protests “Stop. Don’t. Come back”).
Even if the Fed does “tweak” rates lower next year, as it has done in other non-recessionary cutting cycles (we profiled each of these in a recent Weekly Edge), we do not think the Fed will deliver the full 120 bps of easing that is expected.
As shown in the recent Weekly Edge, the historical threshold is 75 bps, or three cuts, where the Fed has cut rates without a recession (cutting for reasons that the market celebrates). Anything beyond 75 bps has been associated with a recession (cutting for reasons the market does not celebrate, as it coincides with a drop in economic and earnings growth).
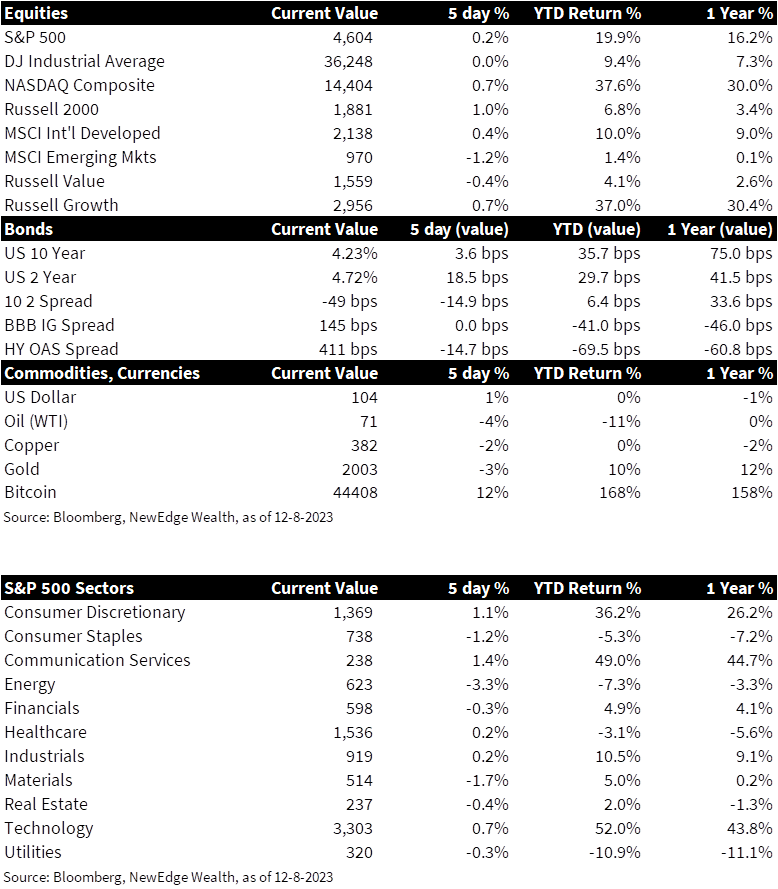
This raises a point of dissonance between the expectation for recession-level rate cuts, and current consensus expectations for continued economic and earnings resilience (consensus expects +11% growth in both 2024 and 2025 for S&P 500 earnings, meaning no recession is contemplated in current estimates).
2. Watch the economic forecasts in the Summary of Economic Projections (SEP).
In addition to the Dot Plot, the Fed will also be updating its Summary of Economic Projections, which includes forecasts for growth, inflation, unemployment and more.
The table below compares the Fed’s September SEP forecasts to current consensus forecasts for key metrics.
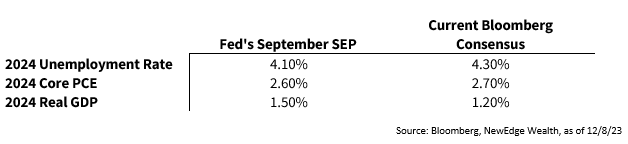
Unlike September, when it was clear that updates were needed to the forecasts, based on the progression of data through the year, how the Fed might update these forecasts at next week’s meeting is far less clear.
It is interesting that economist forecasts are for higher unemployment and lower growth next year compared to the Fed’s forecast. This is similar to the start of 2023, where economists were projecting much slower economic growth and higher unemployment that what has materialized through this year. Could this set up for upside economic surprise in 2024, assuming resilient growth, as it was in 2023?
3. Listen for a level of comfort with the recent easing in financial conditions.
After the roaring bond and equity rallies in November, financial conditions, using the Bloomberg Financial Conditions Index, are now at their easiest levels in all of 2023. Financial conditions indices combine factors like equity valuations, credit spreads interest rates, and currencies to determine the degree of financial stress in the markets and the economy.
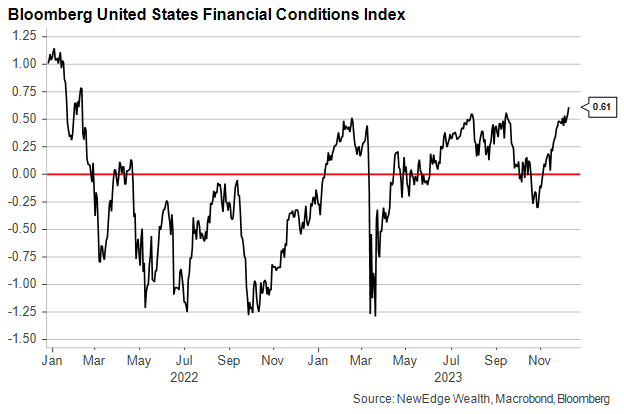
The Fed considers Financial Conditions as the mechanism by which monetary policy impacts the economy, with easy financial conditions (above 0) being stimulative to growth and tight financial conditions (below 0) being restrictive to growth.
When the Fed embarked on this tightening cycle in 2022, it considered financial conditions to be too easy, stimulating growth and keeping inflation above its 2% target. This created urgency to talk financial conditions, and thus markets, lower.
Now, as inflation has ebbed, there is likely less urgency to jawbone financial conditions meaningfully lower, however, it will be very interesting to gauge the Fed’s comfort with just how easy/stimulative financial conditions are today.
For example, if financial conditions remain easy or get even easier as markets continue to rally, could this spur continued growth above trend and risk inflation remaining above target?
It is clear that November’s rallies remove the Fed’s narrative of “the market is doing the work for us”, so could we see a shift to a narrative of “the market is working against us” if financial conditions get too easy?
In addition to all of these considerations, we also get a deluge of important and relevant data next week (CPI on Tuesday, PPI on Wednesday, and Retail Sales on Thursday), which will provide insight into the state of inflation and consumption in the U.S.
Until then, “enjoy the silence” of a few more days without Fed speak!
IMPORTANT DISCLOSURES
Abbreviations/Definitions: Bloomberg U.S. Financial Conditions Index: a Z-score tracking the overall level of financial stress in the U.S. money, bond, and equity markets to help assess the availability and cost of credit; Core PCE: personal consumption expenditures prices excluding food and energy prices; CPI: Consumer Price Index; Dot Plot: The Fed dot plot is published quarterly as a chart showing where each of the 12 members of the FOMC expect the federal funds rate to be for each of the next three years and the long term; Powell: Jerome Powell, Chair of the Board of Governors of the Federal Reserve System; PPI: Producer Price Index.
Index Information: All returns represent total return for stated period. S&P 500 is a total return index that reflects both changes in the prices of stocks in the S&P 500 Index as well as the reinvestment of the dividend income from its underlying stocks. Dow Jones Industrial Average (DJ Industrial Average) is a price-weighted average of 30 actively traded blue-chip stocks trading New York Stock Exchange and Nasdaq. The NASDAQ Composite Index measures all NASDAQ domestic and international based common type stocks listed on the Nasdaq Stock Market. Russell 2000 is an index that measures the performance of the small-cap segment of the U.S. equity universe. MSCI International Developed measures equity market performance of large, developed markets not including the U.S. MSCI Emerging Markets (MSCI Emerging Mkts) measures equity market performance of emerging markets. Russell 1000 Growth Index measures the performance of the large- cap growth segment of the US equity universe. It includes those Russell 1000 companies with relatively higher price-to-book ratios, higher I/B/E/S forecast medium term (2 year) growth and higher sales per share historical growth (5 years). The Russell 1000 Value Index measures the performance of the large cap value segment of the US equity universe. It includes those Russell 1000 companies with relatively lower price-to-book ratios, lower I/B/E/S forecast medium term (2 year) growth and lower sales per share historical growth (5 years). The BBB IG Spread is the Bloomberg Baa Corporate Index that measures the spread of BBB/Baa U.S. corporate bond yields over Treasuries. The HY OAS is the High Yield Option Adjusted Spread index measuring the spread of high yield bonds over Treasuries.
Sector Returns: Sectors are based on the GICS methodology. Returns are cumulative total return for stated period, including reinvestment of dividends.
The views and opinions included in these materials belong to their author and do not necessarily reflect the views and opinions of NewEdge Capital Group, LLC.
This information is general in nature and has been prepared solely for informational and educational purposes and does not constitute an offer or a recommendation to buy or sell any particular security or to adopt any specific investment strategy.
NewEdge and its affiliates do not render advice on legal, tax and/or tax accounting matters. You should consult your personal tax and/or legal advisor to learn about any potential tax or other implications that may result from acting on a particular recommendation.
The trademarks and service marks contained herein are the property of their respective owners. Unless otherwise specifically indicated, all information with respect to any third party not affiliated with NewEdge has been provided by, and is the sole responsibility of, such third party and has not been independently verified by NewEdge, its affiliates or any other independent third party. No representation is given with respect to its accuracy or completeness, and such information and opinions may change without notice.
Investing involves risk, including possible loss of principal. Past performance is no guarantee of future results.
Any forward-looking statements or forecasts are based on assumptions and actual results are expected to vary from any such statements or forecasts. No assurance can be given that investment objectives or target returns will be achieved. Future returns may be higher or lower than the estimates presented herein.
An investment cannot be made directly in an index. Indices are unmanaged and have no fees or expenses. You can obtain information about many indices online at a variety of sources including: https://www.sec.gov/answers/indices.htm.
All data is subject to change without notice.
© 2026 NewEdge Capital Group, LLC

