


Introduction – “Take this sinking boat and point it home”
Economic data is pointing to a slowdown in activity, but markets seem far from concerned. The S&P 500 is back at all-time highs, and companies are expected to report growing earnings for the second quarter. At the same time, consensus U.S. growth forecasts are mired around 1.5% for both 2025 and 2026, barely half of the rate of the prior two years. But betting markets’ recession odds for this year are lower than normal, and equity and credit markets are behaving as if there is no serious risk. One possible reason: while the U.S. economy is getting weaker, it is not doing so at an alarming rate, as it often does prior to recessions.
“Falling Slowly” is probably not a stable economic equilibrium, but it does happen to be the name of the tune that won Best Song at the 2008 Oscars. From the small musical film, Once, which was later adapted into a hit for the Broadway stage, the song’s melancholy chords and hopeful lyrics are an apt combination to describe the interaction between the data and the markets in the summer of 2025.

What parts of the economy have slowed? – “Well, you have suffered enough”
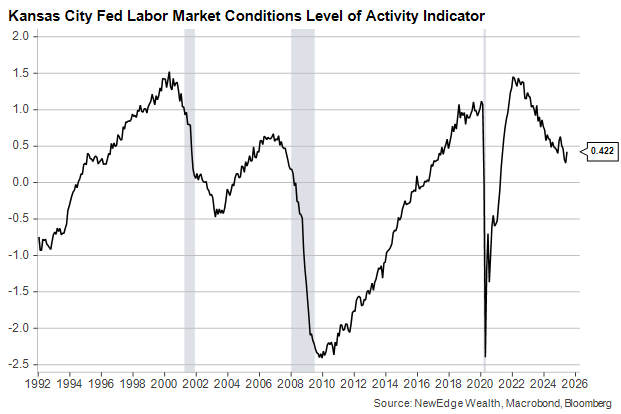
The June U.S. employment data epitomized the concept of “falling slowly”, showing weaker private hiring and wage growth coupled with a drop in unemployment. Even outside of that report, the June labor market was a mixed bag. More employers are reporting difficulty finding workers, but more people are collecting unemployment insurance. This is exactly the kind of data juxtaposition that defines what we called the Summer of Mudd in our Midyear Outlook.
The labor market typically does fine until it doesn’t, at which point it weakens quickly. That has not happened in this cycle. What we’ve seen instead are periods like last summer in which it looked like things were about to collapse, followed by periods like Q4 of last year in which things seemed much more stable, as the Kansas City Fed’s comprehensive index shows:
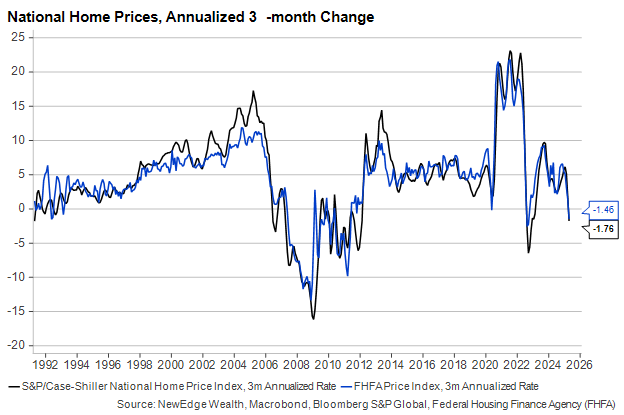
Home prices nearly always respond slowly to changes in monetary policy – their swift and brief swoon in 2022 was a notable exception – and there are clear signs that more than three years after the first Fed rate hikes of this cycle, the long-standing imbalance between high demand and low supply of housing is reversing. Inventories are climbing just about everywhere in the country as new listings rise, and mortgage rates remain elevated:
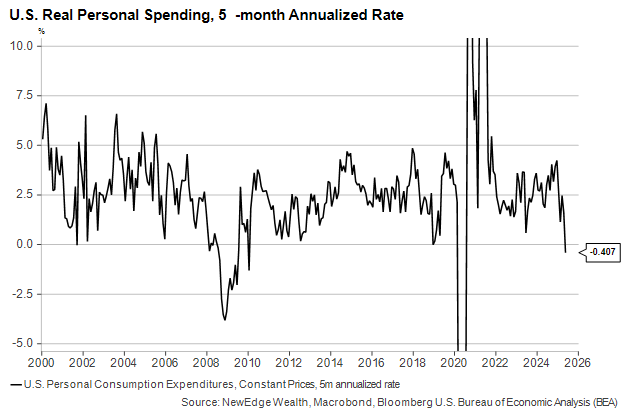
Lower home prices mean lower household wealth, and households that feel less wealthy tend to save more and spend less. The link between home values and consumer behavior is showing up in the data, and not for the better. After accounting for inflation (which has not been particularly high), consumer spending growth has been negative thus far in 2025:
Drops in home prices and real consumer spending are rare enough that they seem likely to spark some market response. But as we pointed out in the introduction, investors are still willing to pay high valuations for risk assets. Many are paying more attention to the “slowly” than the “falling”, and to understand why, we need to examine why the cycle isn’t slowing faster.
How have markets remained resilient? – “Words fall through me and always fool me”
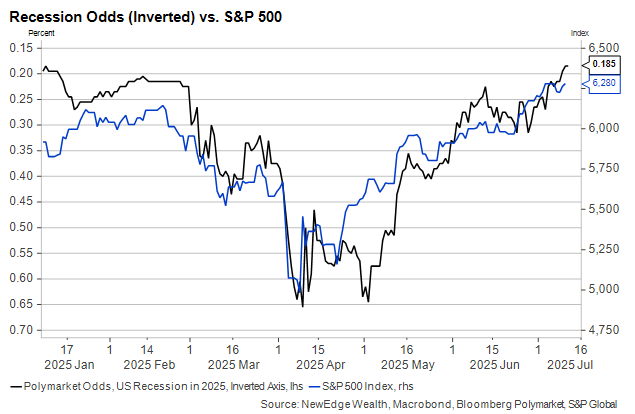
The U.S. re-raised tariffs on imports from a slew of trading partners this week, with levels generally returning to the April 2 Liberation Day rollout before it was dramatically scaled back a few days later. Those original tariff rates, which were in the 20-30% range, sent 2025 recession odds well above 60% and nearly drove the S&P 500 into a bear market.
Investors seem less concerned about the economic impact of prohibitive import taxes today than they did just three months ago, possibly, in part, because their impact has yet to show up noticeably in the inflation data. We think it would be a mistake to assume that tariffs will not eventually impact inflation and growth, but investors are overruling us. Recession odds are back to normal, and the S&P 500 performance this year has mirrored them to an impressive degree:
To be fair to those optimistic online bettors, it’s difficult to have a recession without a rise in unemployment. And it’s harder to get a rise in unemployment when the working-age population is shrinking, which it is doing thanks to White House immigration policies. The graph below shows the number of people – employed and otherwise – in the U.S. labor force. The red circle marks a January jump that was due to a one-time data revision, not a large one-time influx of new workers. Taking that bump out, the line has been flat the past eighteen months and down in 2025.
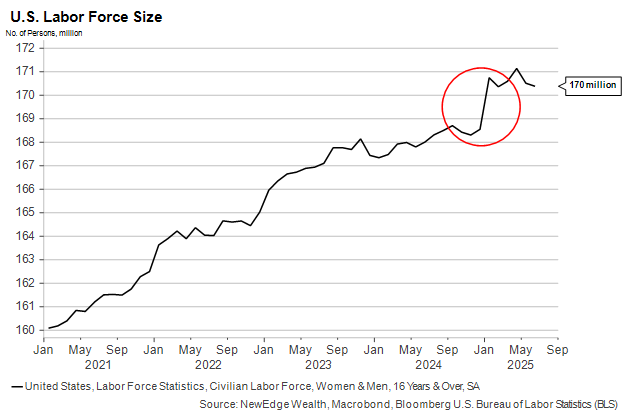
If an economy is not creating new workers, it does not need to create new jobs. That means the unemployment rate can stay low and stable even with weak monthly payroll gains. Lower labor force growth typically means lower economic growth, to be sure, but the “breakeven” rate of job creation needed to avoid recession is not far above zero.
Oh, right! The tax bill! – “I don’t know you, but I want you all the more for that”
One possible source of new jobs this year will be accountants required to parse the dozens of new tax rules in the just-passed One Big Beautiful Bill Act (OBBB). This underscores the importance of having a comprehensive financial plan that can change when the tax code does. But our chief concern in the context of this piece is what, if any, implications the bill will have for economic performance and market behavior.
One thing that proponents and opponents of the OBBB seem to agree on is that it will deliver economic stimulus in the short term (i.e., in 2026). Federal stimulus, in the aggregate, derives from an expansion of the budget deficit as a percentage of GDP. The front-loaded tax cuts and delayed spending reductions in the OBBB mean that the federal deficit as a share of GDP will rise by close to 1% next year.
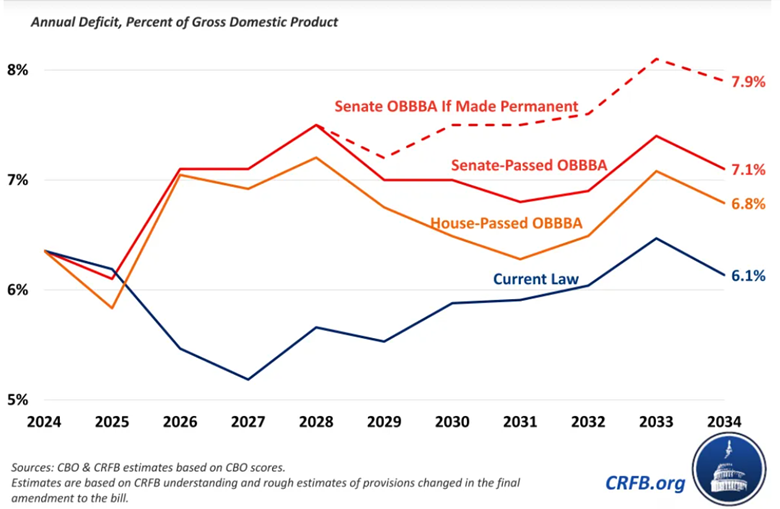
Whether the OBBB delivers further stimulus down the road depends on whether many of the tax exemptions – on tips, car loan interest, state and local taxes, and overtime, among others – expire as scheduled in 2029 or are renewed. The dotted red line on the graph above is an estimate of what the budget deficit will be if all the tax cuts in the OBBB are made permanent rather than being allowed to expire as scheduled in 2029.
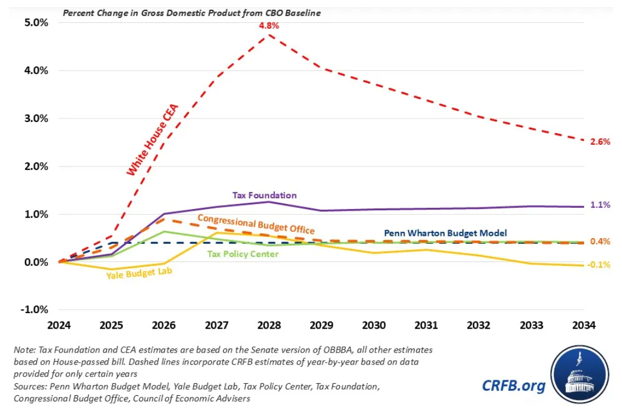
Among the various public and private wonks attempting to model the OBBB’s economic impact, virtually all show a 0.5% to 1.0% additional boost to GDP in 2026. Only the White House’s estimate, which doesn’t account for potentially higher interest rates and federal debt costs, shows additional positive impacts through 2028. The consensus around near-term stimulus, however, could boost investor optimism about the next 18 months and lead to a stabilization in corporate earnings estimates. As we pointed out in the introduction, consensus GDP forecasts for 2026 do not show any acceleration in growth, but this may change following the bill’s passage last week.
Models that attempt to account for dynamic factors like interest rates (e.g., the CBO, Penn Wharton Model, and the Yale Budget Lab) show the short-term sugar high giving way to a growth hangover in the 2030s as the economy slows modestly due to higher borrowing costs. Of course, these are assumptions built on assumptions and should not be relied on too heavily when making investment decisions beyond the next year.
Risks – “Games that never amount to more than they’re meant will play themselves out”
Investors who take the prior section to heart and dive into this market headfirst incur several risks. First, while financial conditions have eased considerably since early April, an unwelcome (but widely forecast) increase in inflation as soon as next week’s U.S. CPI release risks hurting sentiment if it caused interest rates to rise.
On the flip side, should inflation fail to show up meaningfully this summer (say, because falling rent inflation offsets rising goods costs), it could be a sign that the Fed has kept policy too tight for too long.
Lastly, should the Fed and its peer central banks around the world step up their monetary easing in the face of economic weakness, there is also a risk that fiscal expansion (not just in the U.S. but in Europe, as well) will thwart attempts to bring down longer-term rates that drive private investment decisions.
Investment implications – “Raise your hopeful voice, you have a choice”
The middle route between overheating and recession involves lower interest rates, higher corporate earnings, and upgrades to the 2026 growth outlook between now and the end of the year. As we showed above, nearly all this year’s equity market volatility has come from the onset and retreat of tariff-driven recession fears.
Now that those fears are largely gone, what are investors to do? First, we do not believe we are on the cusp of an “early cycle” environment that will produce an enduring market pivot toward cyclical and smaller-cap firms. As we saw around this time last year, a handful of rate cuts can stoke a few weeks of small-cap outperformance, amplified by a positioning chase as we highlighted in last week’s Monday charts, but the effect can fade fast if it doesn’t look like growth is taking off.
At the same time, emphasizing profitability, reasonable valuation, and low indebtedness (i.e., Quality) has not been a consistent generator of outsized returns this year, as low-quality, high-beta, risky stocks have experienced the greatest upside. Our expectation is that earnings for the difficult second quarter will separate the wheat from the chaff in this regard and benefit companies with superior inventory management and stronger brands.
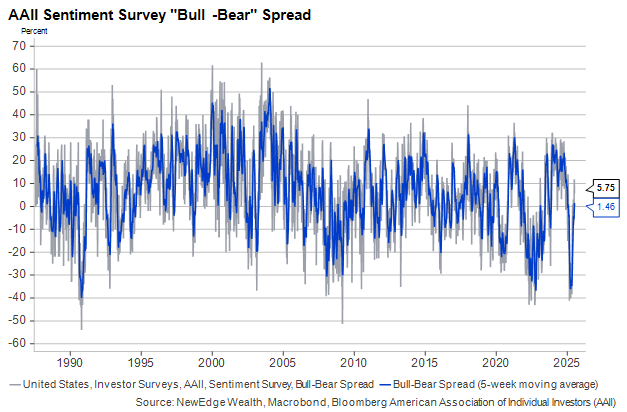
Lastly, we are carefully watching sentiment and positioning in the equity market. For the past several months, the so-called “pain trade” was higher for stocks as under-allocated investors frantically put cash to work for fear of missing out on the recovery rally. Sentiment surveys like the AAII poll on this graph are back in bullish territory, and the latest data on positioning shows some reversion to the mean.
To sum up, we expect the Q2 rally to slow somewhat in Q3 but not cease altogether, provided the macro picture stabilizes and investors’ positioning/sentiment continues to lead them to chase strength higher. Earnings momentum has improved, but the results that begin rolling out next week will need to justify this cautious optimism, or markets could tumble again from their high valuations.
The policy environment remains chaotic and unpredictable, even with the debt ceiling lifted and tax policy cemented into law. Markets have become desensitized to tariff announcements, for better or worse, but if “falling slowly” turns into “falling quickly” for employment or consumer spending, investors’ Pavlovian inclination to buy the dip will be tested.
IMPORTANT DISCLOSURES
All data is as of June 20, 2025, unless otherwise noted.
The views and opinions included in these materials belong to their author and do not necessarily reflect the views and opinions of NewEdge Capital Group, LLC.
This information is general in nature and has been prepared solely for informational and educational purposes and does not constitute an offer or a recommendation to buy or sell any particular security or to adopt any specific investment strategy.
NewEdge and its affiliates do not render advice on legal, tax and/or tax accounting matters. You should consult your personal tax and/or legal advisor to learn about any potential tax or other implications that may result from acting on a particular recommendation.
The trademarks and service marks contained herein are the property of their respective owners. Unless otherwise specifically indicated, all information with respect to any third party not affiliated with NewEdge has been provided by, and is the sole responsibility of, such third party and has not been independently verified by NewEdge, its affiliates or any other independent third party. No representation is given with respect to its accuracy or completeness, and such information and opinions may change without notice.
Investing involves risk, including possible loss of principal. Past performance is no guarantee of future results.
Any forward-looking statements or forecasts are based on assumptions and actual results are expected to vary from any such statements or forecasts. No assurance can be given that investment objectives or target returns will be achieved. Future returns may be higher or lower than the estimates presented herein.
An investment cannot be made directly in an index. Indices are unmanaged and have no fees or expenses. You can obtain information about many indices online at a variety of sources including: https://www.sec.gov/answers/indices.htm.
All data is subject to change without notice.
© 2026 NewEdge Capital Group, LLC
