


How’s it going to be
When you don’t know me anymore
“How’s it Going to Be”, Third Eye Blind
“How’s it going to be, when you don’t know me [the tightening cycle] anymore?”
The mid-to-late 1990’s were a great time for two things: music and non-recessionary Fed pivots.
On the music front, it was a glorious and abundant era for debut albums, including Third Eye Blind’s self-titled release, arguably one of the greatest, yet most underrated, albums of the time.
On the pivot front, Federal Reserve Chairman Alan Greenspan orchestrated two rounds of rate cuts, in 1995 and 1998, that were met with glee by markets as the U.S. economy boomed.
So as current Federal Reserve Chairman Powell was “Livin’ in the 90’s” this week, signaling a pivot to easier monetary policy without imminent recession (just like in 1995 and 1998), we dust off our debut Third Eye Blind CD and ask “how’s it going to be?” for markets and the economy now that the tightening cycle is (or at least is expected to be) over.
We see three potential scenarios emerging from this policy pivot: 1) Everything is Awesome, 2) Everything is Too Awesome, 3) The Stop-Go Ghost of Burns.
Before diving into these scenarios, it is important to note that we could experience more than one of these outcomes over time. For example, we could experience Scenario 1 (strong growth with subdued inflation) before it morphs into either Scenario 2 (a speculative bubble) or Scenario 3 (a reacceleration of inflation that prohibits the Fed from pivoting or causes a reversal to tighter policy).
Note, we do not outline a classic recession scenario in this piece, which of course would allow the Fed to cut but with the unwelcome challenge of falling growth. We do not expect an imminent recession in 1H24 but continue to monitor data and markets for signals of deterioration.
We also must be cognizant of what scenarios are already being priced in to markets to avoid a “buy the rumor, sell the news” outcome. This is why we monitor factors like positioning, sentiment, valuations, and expectations across asset classes to gauge what is already being captured in current prices.
Scenario 1: Everything is Awesome
“I wonder what are we fighting [inflation] for”
This first scenario is effectively an extension of the economic expansion, where the U.S. economy continues to chug along, all the while inflation continues on a path that is satisfactory for the Fed to keep an easing bias to policy. 1995 redux.
The shift to easier policy by the Fed brings animal spirits back to life, as the anticipation of easier policy helps to spur investor and company confidence.
This is the inverse of what happened in 2022. Long before rates moved substantially higher, the anticipation of tighter policy and higher rates was enough to freeze M&A and IPO markets, chill speculative investment fervor, and slow interest rate-sensitive areas of spending/investment, such as housing, commercial real estate, and autos.
Interest rates are likely to be higher in absolute terms in 2024 than in 2022, but by replacing the worry of higher rates with the hope for lower rates, we could see investors and companies more willing to take risks and complete transactions.
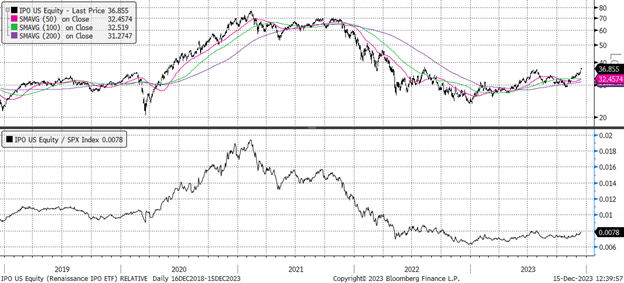
We watch the Renaissance IPO Index to track the progress of improved investor/company confidence and risk appetite.
Renaissance IPO ETF (IPO) Absolute (Top) and Relative to the S&P 500 (Bottom)
This backdrop of improved sentiment could help to keep the labor market tight, as confident companies do not feel the need to retrench, which would then allow consumer spending to remain resilient.
As the prospect of truly “higher for longer” fades, lower rates would (somewhat) ease the balance sheet burden for those borrowers with floating rates or refinancing needs. Note that many borrowers will still see an increase in borrowing costs in coming years, mostly if debt from ultra-low rate periods like 2020 and 2021 is being refinanced.
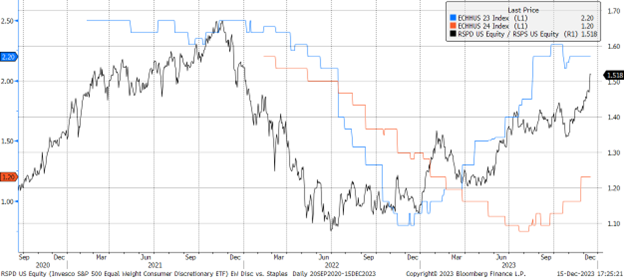
In this Everything is Awesome scenario, estimates for GDP and Consumer Spending in 2024 would likely be revised higher. Bloomberg consensus has 2024 GDP and Consumer Spending slowing to 1.2%, about half the pace of growth experienced in 2023. The strong performance of Consumer Discretionary vs. Consumer Staples could indicate that the equity market thinks growth estimates are in fact biased higher.
The Equity Market Signals Rising Estimates for Consumer Spending
Equal Weight Consumer Discretionary vs. Staples, Consumer Spending Consensus Forecasts for 2023 and 2024
To achieve better growth without higher inflation, all while the labor market remains tight, productivity will have to be strong next year. Many will site AI as the source of this future productivity, comparing this time to the 1990s “productivity miracle”, but there is nuance to the drivers of 90s productivity.
For markets, this Everything is Awesome scenario would be broadly supportive of risk assets. In simplistic terms, an easier Fed would support valuations, while a resilient economy would support earnings estimates. We note that valuations and earnings estimates are starting from high levels (19.6x forward PE on 2024 EPS +12% for the S&P 500), so it can be argued that, to an extent, this scenario is what is being priced in at current index levels. We will have to monitor positioning, sentiment, valuations, and growth expectations to judge the bar for upside surprises (these measures are extended but not at extremes).
The improved risk appetite, upside to growth estimates, and lower bias to interest rates could allow the recent relief rallies in interest rate sensitive and sentiment sensitive parts of the market to continue (areas such as small caps, micro caps, real estate, financials, and high beta). It is important to note that these areas are highly volatile, with many low-quality constituents in each index, meaning rallies can quickly reverse if economic developments disappoint. This makes selectivity and valuation discipline imperative.
This scenario could also support rotations in leadership away from 2023’s defensive growth leadership and into laggard areas like cyclical value, mostly if economic growth sentiment continues to improve.
For yields in this scenario, short rates would likely be biased lower (as the Fed actualizes the previewed rate cuts), while long rates have more cross currents (such as inflation breakevens, Treasury funding, and resilient growth). Long rates surprisingly moving higher would upset this Scenario 1, as it could challenge the balance sheet relief narrative.
Scenario 2: Everything is Too Awesome
“The soft dive of oblivion”
This second scenario is the same as the first, just with the unintended consequence of a speculative bubble building in risk assets. 1998 redux.
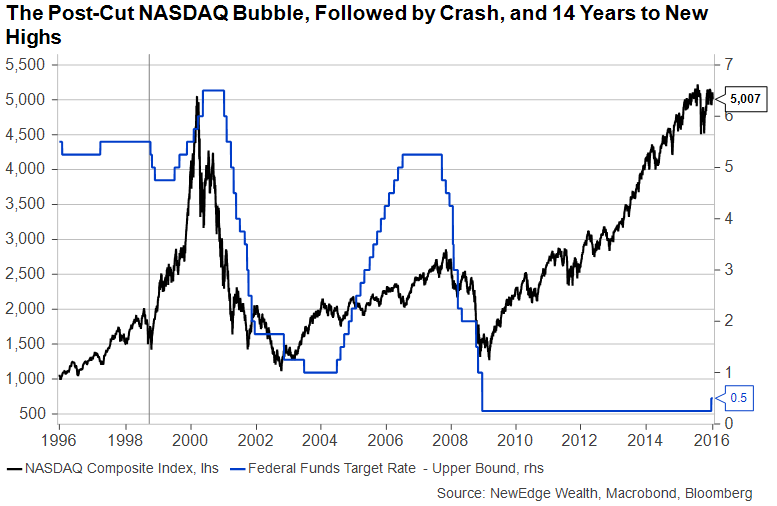
In 1998, Greenspan’s rate cuts to insulate the U.S. economy from financial market stresses (LTCM meltdown, Asian currency crisis, Russia debt default) had the unintended consequence of throwing accelerant on the already hotly-burning speculative fire in equity markets. There were a lot of other factors, such new technology adoption, that set the stage for this epic bubble (using Quinn and Turner’s framework from their must-read Boom and Bust book), but the added liquidity and boost to sentiment from Fed cuts allowed speculative sentiment to run wild.
From the first cut in late 1998 to early 2000, the NASDAQ rallied over 200%, trading to over 100x forward PE. Of course, what came after was highly detrimental to many investors caught in the late days of the bubble: the NASDAQ collapsed nearly 95% and it took 14 years to make a new all-time high. Asset bubbles are destabilizing to markets, and thus this would not be a welcome outcome by the Fed.
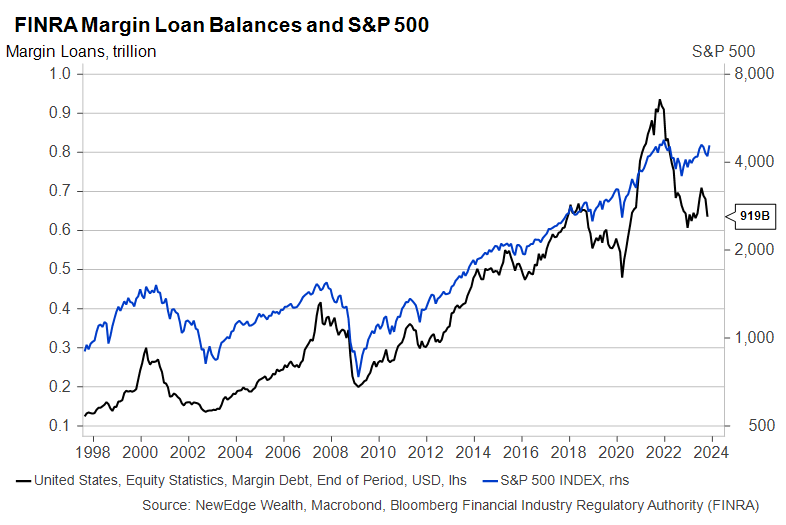
This scenario is not our base case and we are a long way from bubble territory, but we will have to monitor data like household equity allocations, margin loan balances, option activity, and sentiment measures in order to see if speculative fervor is building (none of these measures are extreme yet).
Scenario 3: The Stop-Go Ghost of Arthur Burns
“Don’t see lightning like last fall, when it was always about to hit me”
The third scenario post pivot is another one of unintended consequences, but it could take some time to play out.
In this scenario, as the Fed eases policy, economic growth remains resilient, but it comes with an unwelcome reacceleration in inflation, preventing the Fed from delivering on the rate cut hopes and dreams of markets, and even, if the reacceleration is pronounced and protracted enough, could result in more hikes. Again, this would take time to play out, so could be more of a late 2024, 2025 consideration.
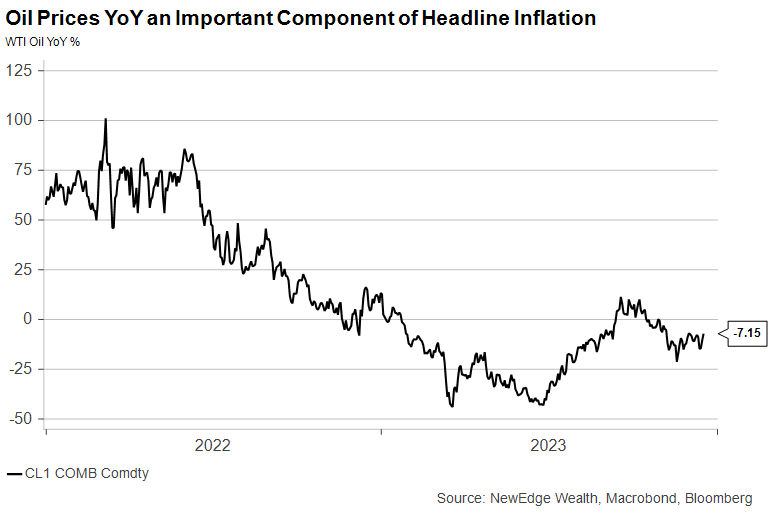
We could see the dollar weaken materially as the Fed eases policy, which could spark rallies in commodity prices, mainly energy. Falling energy prices have been the largest contributor to disinflation since inflation’s peak in the summer of 2022, so a return to rising prices could upset the steady fall in inflation readings.
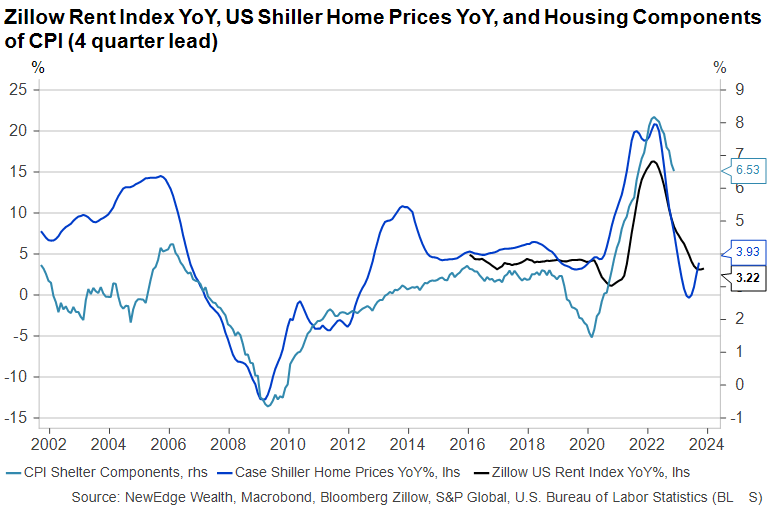
Further, falling interest rates could spur a return of activity and price increases in interest rate sensitive parts of the economy, such as housing and autos. Home prices YoY already bottomed in May 2023, so a drop in mortgage rates could reaccelerate price growth and housing related inflation.
As the economy remains resilient, the labor market would likely remain tight, keeping wage growth elevated (mostly if the recent large increase in the labor force thanks to immigration begins to slow).
This is not an argument for a return to the prior peaks of inflation, fueled in part pandemic-era, supply-chain challenges. Instead, it is to argue that the Fed’s assertion that inflation is confidently moving back to 2%, even as they cut, could be challenged, thus resulting in an inability to deliver on forecasted and predicted rate cuts.
We should also note that if the Fed delivers on rate cuts in 2024, they will be easing monetary policy when fiscal policy is also stimulative, given the elevated deficit to GDP, which has been at record levels for non-recession, peace-time periods.
In this scenario, yields would likely be biased higher across the curve (long and short), while equities that trading at high valuations in anticipation of an easier Fed and lower rates could have a rude awakening. Resilient growth and higher inflation would help keep earnings afloat, but we would likely see a retrenchment in risk-appetite (and a reversal of Scenario 1 rallies) given the tighter Fed.
Conclusion
Powell’s press conference on Wednesday that opened the door for rate cuts was a notable shift to dovishness after the last two years of hawkish policy and communication (it was also a notable shift from just two weeks ago, when Powell called discussions of rate cuts “premature”). There has already been pushback against Powell’s dovishness, with New York Fed President Williams saying on Friday that the Fed is actually not “really talking about rate cuts”.
The scenarios outlined above would all take time to develop, and there are sure to be many conflicting and changing narratives along the way. Further, the market’s propensity to get ahead of itself in pricing in outcomes could mean that asset prices could diverge from what seems logical by the data. We will remain vigilant tracking sentiment, positioning, valuations, earnings estimates, technicals, bottom up fundamentals, macro data, and much more.
Top Points of the Week
By Austin Capasso and Ben Lope
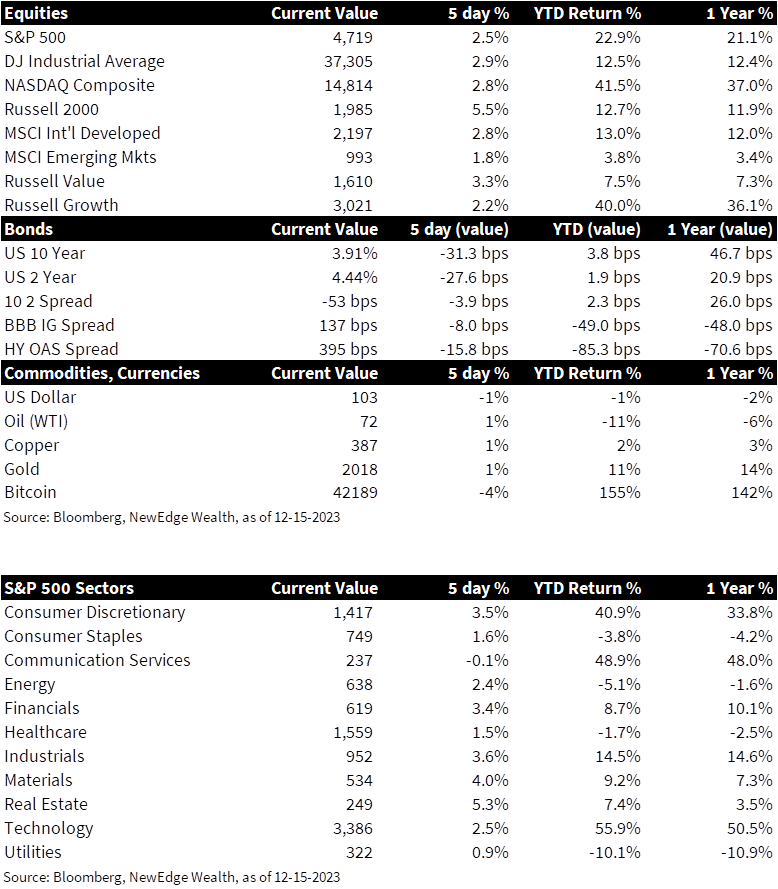
1. Global Equities Climb Higher – Global equities moved markedly higher on the week, largely powered by positive takeaways from the Fed’s projection of rate cuts in 2024. Small caps led the charge in the US, with the Russell 2000 up over 5%, while larger indices such as the S&P 500, Dow Jones Industrial Average, and NASDAQ Composite were each up around 2.5%. International equities moved higher as well, with the MSCI International Developed Markets index slightly outpacing the MSCI Emerging Markets index.
2. Rates Fall on the Back of Projected Fed Rate Cuts – In a near parallel shift of the yield curve, rates on 2 and 10 year Treasury bonds each fell approximately 30bps on the week. The Fed’s quarterly economic projections implied three rate cuts in 2024, encouraging traders to seize on Treasury bonds with rates that may not be as high come this time next year. Rates on 2 year Treasury bonds decreased by a few basis points more than those on 10 year Treasury bonds, resulting in the 2-10 year yield curve becoming ever so slightly more inverted.
3. Federal Reserve Holds Rates Steady – The Federal Reserve left interest rates unchanged, keeping the federal funds rate with the 5.25% – 5.50% range for the third consecutive meeting. Equity markets moved higher on the back of updated Fed projections for three rate cuts in 2024, which would see the benchmark rate fall to approximately 4.6%. While a “soft landing” appears increasingly likely, Fed officials were quick to note that inflation remains elevated beyond their 2% target range, which leaves open the possibility of “additional policy firming” should conditions warrant it.
4. ECB Holds Rates Steady – At the culmination of their meeting on Thursday, the European Central Bank left their benchmark rate unchanged. Despite acknowledging progress in bringing down inflation, ECB president Christine Lagarde stated that the central bank does not intend to “lower [their] guard.” Eurozone inflation registered 2.4% in November, the lowest level in two years but still above the ECB’s 2% target. The central bank’s key rate remains at a record high of 4%.
5. Bank of England Holds Rates Steady – At their final policy meeting of the year, the Bank of England left interest rates unchanged. The UK benchmark interest rate remains at 5.25%, the highest level in 15 years. The individual voting decisions of the monetary policy committee voting members highlight differences between the policy vision of US central bank voting members, who unanimously voted on holding rates steady in their most recent meeting, and the policy vision of Bank of England voting members, where one-third favored increasing the benchmark rate by 25bps.
6. Solid Retail Sales Report to Kick Off the Holiday Season – The closely watched US retail sales report, which gives investors a good gauge on the health of the US consumer, posted positive results. Sales at US retailers rose +0.3% vs -0.1% expected in November, which is an indication that the economy has no plans of cooling off before holiday spending into December kicks in. This increase comes after sales had fallen in October, which was the first decrease in seven months on the report. Economists predicted a lackluster holiday season, but this November report shows signs that retail sales are on track for above-average performance.
7. The Disinflation Narrative in US CPI – US headline Consumer Price Index (CPI) in November increased 0.1% on a monthly basis and 3.1% on an annual basis. Core CPI, which excludes food and energy components of inflation, rose 0.3% on a monthly basis and 4% on an annual basis. These were mostly in line with economists’ expectations. Energy has been the real reason for the disinflation we are seeing within inflation this year. Oil prices were at extremely high levels after the Russia-Ukraine crisis but have since fell over -20% since their high this year in September. The journey to the Fed’s target of 2% continues, but CPI continues to show progress.
8. China CPI for November Falls – The Consumer Price Index (CPI) in China for the month of November saw the fastest decline in three years to 0.5% on both a monthly and annual basis. A drop in CPI is not what China want, considering their recent stunt in growth across the nation. The falloff was attributed to weak domestic demand, which casts doubts over China’s economic recovery and suggests a heightening of inflationary pressure.
9. Adobe Earnings Offer Potential Clues for Next Quarter’s Tech Earnings – Adobe (ADBE) shares are up over 70% year-to-date but pulled back by more than 10% following the company’s announcement of Q3 earnings results this week. ADBE notched a smaller-than-expected earnings beat and offered conservative guidance for future quarters. This is likely going to be a common theme for next quarter’s earnings season. Expectations are high, especially for those in the AI ecosystem that have been market leaders this year, forcing investors to question whether “solid” performance is going to be good enough to drive further upside.
10. Important Week Ahead – Next month is a big one where we get the PCE Index report, revision to GDP, durable-goods orders, personal income and spending data, US consumer sentiment, and a plethora of US housing data. We continue to be data dependent and monitor any implications these releases may have for markets and Fed rate decisions.
IMPORTANT DISCLOSURES
Abbreviations/Definitions: AI: artificial intelligence; Core CPI: measures the changes in the price of goods and services, excluding food and energy; CPI: Consumer Price Index; ECB: European Central Bank; EPS: earnings per share; PCE: personal consumption expenditures; PE: price to earnings ratio, the ratio of share price of a stock to its EPS; Powell: Jerome Powell, Chair of the Board of Governors of the Federal Reserve System.
Index Information: All returns represent total return for stated period. S&P 500 is a total return index that reflects both changes in the prices of stocks in the S&P 500 Index as well as the reinvestment of the dividend income from its underlying stocks. Dow Jones Industrial Average (DJ Industrial Average) is a price-weighted average of 30 actively traded blue-chip stocks trading New York Stock Exchange and Nasdaq. The NASDAQ Composite Index measures all NASDAQ domestic and international based common type stocks listed on the Nasdaq Stock Market. Russell 2000 is an index that measures the performance of the small-cap segment of the U.S. equity universe. MSCI International Developed measures equity market performance of large, developed markets not including the U.S. MSCI Emerging Markets (MSCI Emerging Mkts) measures equity market performance of emerging markets. Russell 1000 Growth Index measures the performance of the large- cap growth segment of the US equity universe. It includes those Russell 1000 companies with relatively higher price-to-book ratios, higher I/B/E/S forecast medium term (2 year) growth and higher sales per share historical growth (5 years). The Russell 1000 Value Index measures the performance of the large cap value segment of the US equity universe. It includes those Russell 1000 companies with relatively lower price-to-book ratios, lower I/B/E/S forecast medium term (2 year) growth and lower sales per share historical growth (5 years). The BBB IG Spread is the Bloomberg Baa Corporate Index that measures the spread of BBB/Baa U.S. corporate bond yields over Treasuries. The HY OAS is the High Yield Option Adjusted Spread index measuring the spread of high yield bonds over Treasuries.
Sector Returns: Sectors are based on the GICS methodology. Returns are cumulative total return for stated period, including reinvestment of dividends.
The views and opinions included in these materials belong to their author and do not necessarily reflect the views and opinions of NewEdge Capital Group, LLC.
This information is general in nature and has been prepared solely for informational and educational purposes and does not constitute an offer or a recommendation to buy or sell any particular security or to adopt any specific investment strategy.
NewEdge and its affiliates do not render advice on legal, tax and/or tax accounting matters. You should consult your personal tax and/or legal advisor to learn about any potential tax or other implications that may result from acting on a particular recommendation.
The trademarks and service marks contained herein are the property of their respective owners. Unless otherwise specifically indicated, all information with respect to any third party not affiliated with NewEdge has been provided by, and is the sole responsibility of, such third party and has not been independently verified by NewEdge, its affiliates or any other independent third party. No representation is given with respect to its accuracy or completeness, and such information and opinions may change without notice.
Investing involves risk, including possible loss of principal. Past performance is no guarantee of future results.
Any forward-looking statements or forecasts are based on assumptions and actual results are expected to vary from any such statements or forecasts. No assurance can be given that investment objectives or target returns will be achieved. Future returns may be higher or lower than the estimates presented herein.
An investment cannot be made directly in an index. Indices are unmanaged and have no fees or expenses. You can obtain information about many indices online at a variety of sources including: https://www.sec.gov/answers/indices.htm.
All data is subject to change without notice.
© 2026 NewEdge Capital Group, LLC

