


Click Here to Listen to the Audio Version
Spring was never waiting for us till
It ran one step ahead
As we followed in the dance.
“McArthur Park Suite”, Donna Summer
Everything is relative.
Those who have trudged their way through this year’s brutal northeast winter know the power of relativity well. There is nothing like a few weeks of -6˚F to make 36˚F feel like balmy t-shirt weather.
So, given the relative thaw in temperatures (never mind the foot of snow that is expected to be dumped on NYC this weekend), we find ourselves reaching for our springtime, emerging-from-the-cave playlists a bit early this year (we also had a request from a colleague for a “happy song” after a recent run of rather moody Weekly Edges).
For us, there is no better genre to welcome in spring than disco, and no better springy disco song than Donna Summer’s nearly 18-minute “McArthur Park Suite” (we don’t do “Radio Edits” here at NewEdge!).
It is also timely to find inspiration in the “McArthur Park Suite” as the newly crowned Olympic gold medalist figure skater, Alyssa Liu, used the song in her show-stopping free skate on Thursday evening. After a two-year break from competing, Ms. Liu made an epic comeback and became the first US skater to win the gold medal in the women’s individual competition since 2002.
Looking at today’s markets, we can see a cohort of stocks trying to be like Alyssa Liu, making a comeback after a period of not performing and aiming to bring back the glory of the early 2000’s gold. This springy cohort of stocks spinning and toe-flipping their way to new leadership is, of course, value. This week’s Edge (which you can probably read while listening to the entire 18 minutes of the “MacArthur Park Suite”) will look at the recent run in Value outperformance and examine the drivers that could make this run in Value sustainable (like in the early 2000s) or just another flash in the pan.
“I Will Win the Worship in Their Eyes and I Will Lose It”: Growth vs. Value Performance Today and Historically
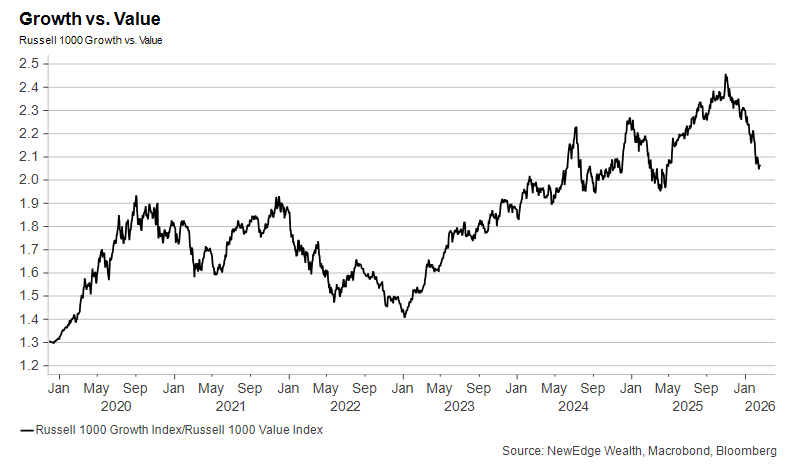
The Russell 1000 Value Index (what we will refer to as “Value”) has outperformed the Russell 1000 Growth Index (what we will refer to as “Growth”) by 11% YTD and 18% since the end of October last year (which marked the turning point for market leadership away from the dominant Growth/Mag 7/Tech leadership and into a grab-bag of laggards including cyclicals, defensives, small caps, and international.
The relative performance chart below (the line going up means that Growth is outperforming Value) shows this rotation since early October, with Growth nearly giving up all of its outperformance over Value since the Liberation Day lows, which of course takes on a new meaning after Friday’s SCOTUS ruling that President Trump’s sweeping tariffs were unconstitutional.
When looking at any rotation and asking how much further it can run, it is helpful to zoom out and put things in a longer historical context. The chart below shows this longer-term perspective, where today’s rotation away from Growth into Value looks like many of the short-term rotations we have seen in the last five years (such as early 2021, 2022, and early 2025). These brief pullbacks in Growth vs. Value occurred within the context of Growth outperforming Value by 280% over the last 10 years and 752% over the last 20 years!
This chart also captures the prolonged period of Value outperformance from 2000-2006, where Value outperformed Growth by a meaningful 117%. This was in the aftermath of the 1990’s tech bubble and during the “real economy”/commodities/international boom of the 2000s.
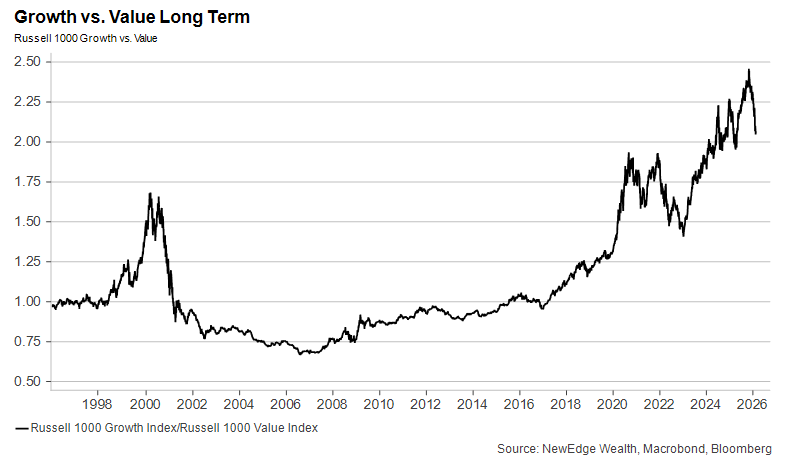
So, the ultimate question is whether today’s rotation will prove to be akin to one of those brief 2020’s “recalibrations” or whether today’s rotation will ultimately look more like that early-2000’s glory, where Value substantially bests growth for a prolonged period.
When attempting to answer this question, it will be helpful to channel the exacting nature of figure skating judges to score the earnings and valuation fundamentals of Growth and Value. First, we need to level set on what is in each index and the details might surprise you.
“You Got Magic”: Index Constitution
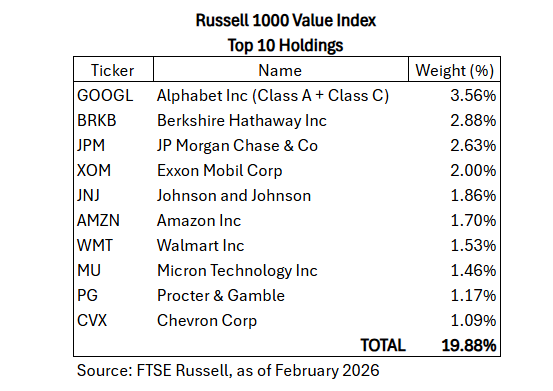
The most surprising statistic when looking at Growth vs. Value is that the largest weight in the Value index is not some old economy Industrial, Financial, or Energy name. Instead, the largest weight in the Value index is the strongest performing Magnificent 7 name over the last 12 months: Google! Talk about having “magic”!
The top ten weights of the Value index also include Mag 7 stock Amazon, AI memory-chip momentum flyer Micron, and other momentum darlings like Walmart and JP Morgan (both are significant weights in momentum factor ETFs).
In many ways, Value has become a far more similar “trade” (or basket of exposures) to Growth than many investors realize. This could present itself as a risk in the future, if, for example, a broader unwind in AI-beneficiary and momentum names would not leave the Value index immune.
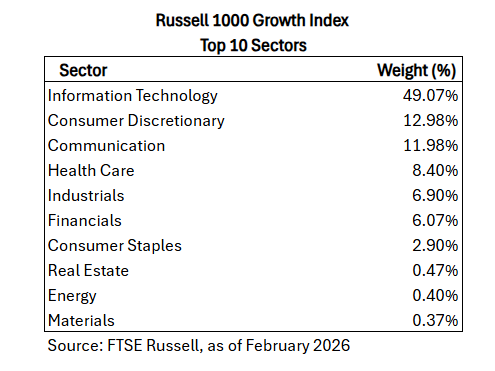
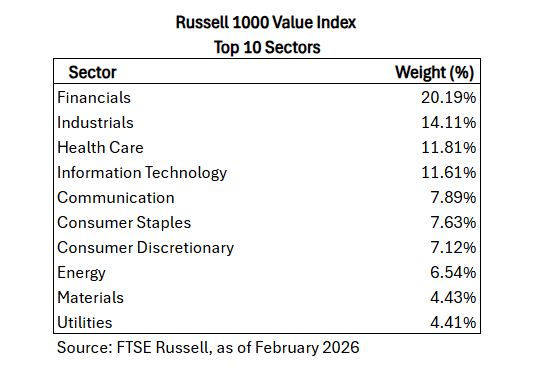
The best thing the Value index has going for it is that it is not as concentrated as the Growth index, which the table below displays. Contrast the top ten weights in Value constituting 20% of the index, vs. the top ten weights in Growth constituting 60% of the index.
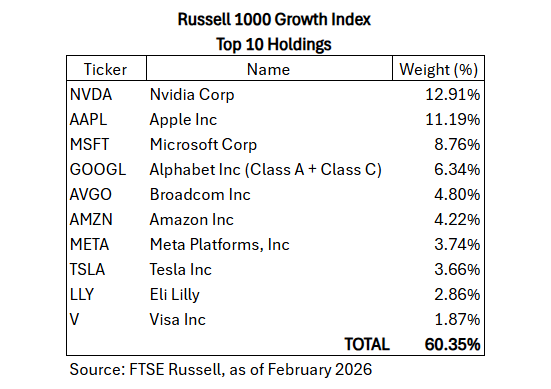
There is one last note to make about index constitution, which will come in handy when we look at earnings trends. The tables below show how Growth remains dominated by Tech, Discretionary, and Communications (74% of the index), while Value’s largest exposures are Financials, Industrials, and Healthcare.
With that, let’s get back to the judging.
“I Will Have the Things That I Desire”: Earnings
We have long argued that index, style, and sector performance is ultimately driven by earnings fundamentals. There are brief periods, including the one we are in today, as we will show, where stock prices can diverge from fundamentals, but over longer periods of time, stock returns do track fundamental results.
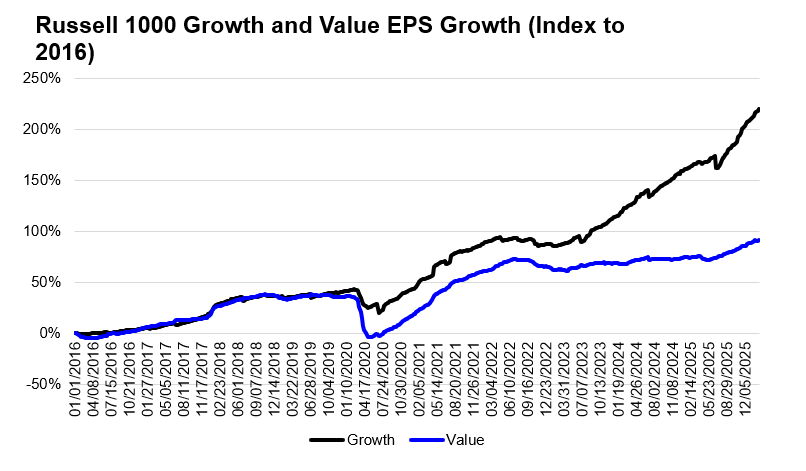
Look no further than the last decade of outperformance of Growth stocks over Value and see how it was justified by powerful Growth earnings. Since 2016, Growth has grown its EPS by a total of 219% versus 91% for Value. Notably, the majority of this outperformance has occurred in the last three years, with Growth earnings +70% and Value earnings up just +16%.
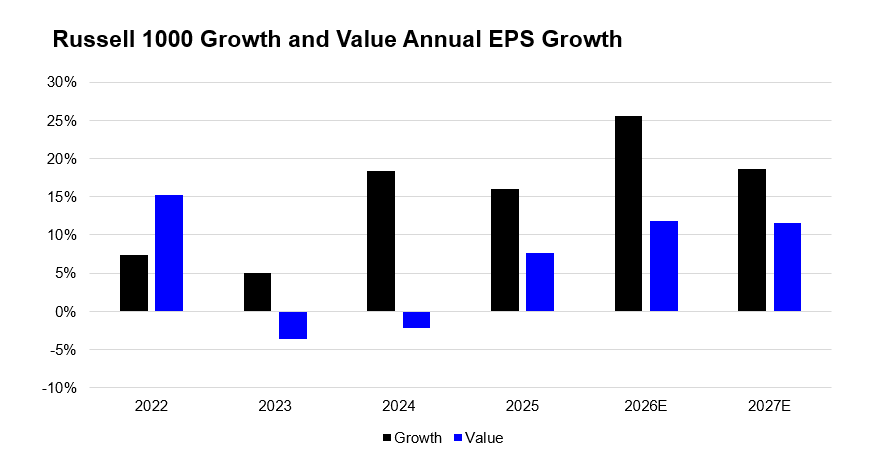
Looking forward, the market is expecting this period of ultra-dominant Growth earnings performance to slow. The chart below shows how Growth was the only area growing earnings from 2023-2025, but from 2025-2027, Value earnings are expected to rebound materially. Investors crowded into and paid up for Growth when earnings growth was scarce, but given expectations for broaderearnings growth in the coming years, we have begun to see the Growth stock outperformance unwind.
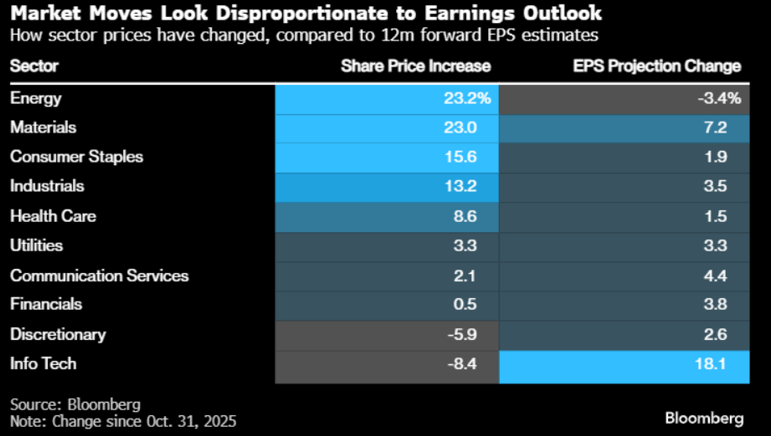
It must be noted that the powerful performance since late October for many Value-heavy sectors has not been backed up by earnings growth. We wrote about this in detail last week, but found this Bloomberg table (thanks JP!) to be highly illustrative. This table shows how the best performing sector, Energy, has had the worst earnings growth and the worst performing sector, Tech, has had the best earnings growth. This could reflect expectations of dynamics like a Middle East conflagration boosting future Energy earnings and AI competition threatening future Tech earnings, but as of right now, these moves have not been supported by near-term fundamentals.
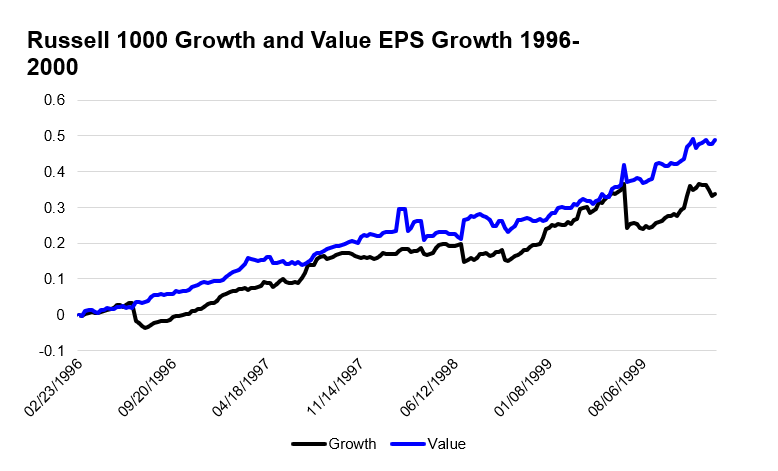
We will repeat our assertion that for this rotation to have legs, we think that it does need support from a sustained period of earnings leadership rotation as well. We saw this during the last period of sustained Value rotation from 2000-2006, where Value grew EPS by 81% vs. Growth’s 37%.
If we cannot make a durable case for why Value earnings can best Growth earnings, or at least substantially close the gap further, then the Value leadership is likely to be more short-lived, and more driven by valuation, as we will detail below. This is a topic we will discuss in greater detail in the coming weeks.
“Down Inside, Don’t Get Caught With Foolish Pride”: Valuations
At the Growth outperformance peak in late October 2025, Growth traded to an 82% premium over Value, near the highs of its valuation premium over the last 10 years, as shown in the chart below.
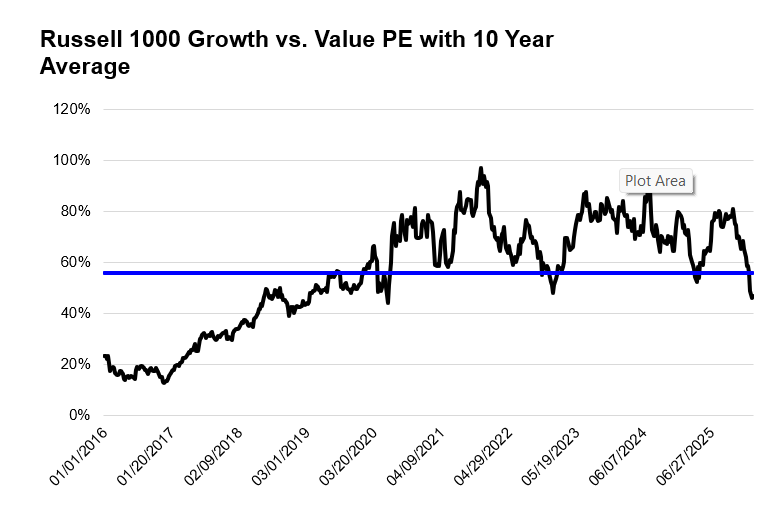
This period of relative underperformance, but still strong earnings growth for the Growth index, has brought its relative premium down to 46%, below the 10-year average and in line with the 30-year average premium. This 46% premium is where Growth’s premium to Value bottomed in 2022, which could suggest that if this is just a positioning and valuation recalibration, Growth could find its relative footing versus Value soon.
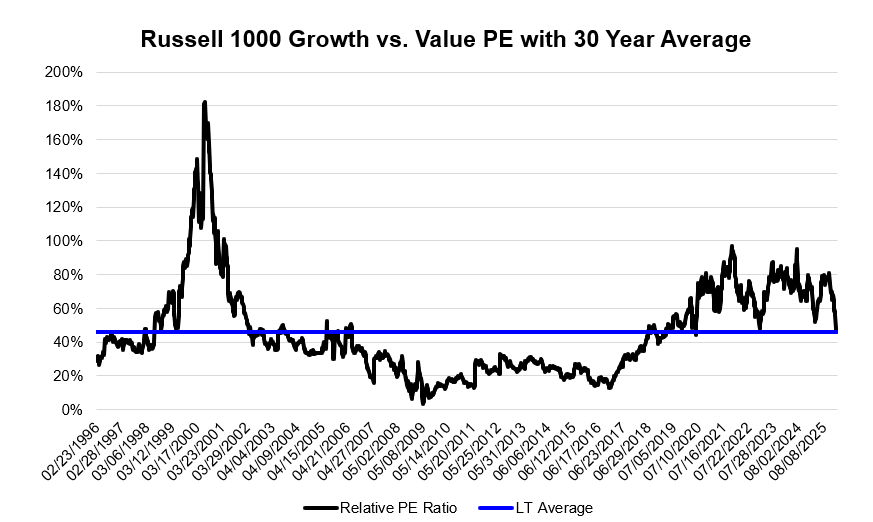
Of course, if this rotation is the start of a bigger shift in earnings fundamentals, we should keep in mind the next chart below, which shows that in the aftermath of the tech bubble unwind (after Growth got to a stellar 180% premium to Value!), Growth saw its monster premium over Value completely evaporate.
“Heaven Knows I Only Wanna Please You”: Conclusion
For the last year, as part of our “shoring up the 60” for equity allocations, we have been arguing for a balanced approach to Growth vs. Value allocations. We have flagged Growth’s dominant earnings as a plus, but premium multiples and crowded positioning as a minus. We have flagged Value’s unpopularity and relative cheapness as a plus and inferior, constantly trimmed earnings as a minus.
From here, some of these pluses and minuses have shifted. Growth’s premium valuation and crowded positioning have abated, but its earnings growth could be less dominant going forward. Value’s valuation is no longer cheap and positioning is more crowded, while the sector’s improved earnings outlook does paint a rosier fundamental picture, but could present a high bar for upside surprises.
If Growth were to continue to cheapen versus Value on positioning and sentiment dynamics, we would find the style to be increasingly attractive on a relative basis. Further, in the coming weeks, we will explore the future earnings scenarios for Growth and Value segments of the market, to further weigh Value’s potential to go for longer-term gold.
One last reminder that Growth and Value indices have become increasingly similar in their factor/theme exposures, meaning these styles could be far more correlated in the future. Overall, Value’s run for the top of the podium, even if accompanied by the siren song of the Queen of Disco herself, is not a given, just like every Olympic figure skater knows all too well.
IMPORTANT DISCLOSURES
The views and opinions included in these materials belong to their author and do not necessarily reflect the views and opinions of NewEdge Capital Group, LLC.
This information is general in nature and has been prepared solely for informational and educational purposes and does not constitute an offer or a recommendation to buy or sell any particular security or to adopt any specific investment strategy.
NewEdge and its affiliates do not render advice on legal, tax and/or tax accounting matters. You should consult your personal tax and/or legal advisor to learn about any potential tax or other implications that may result from acting on a particular recommendation.
The trademarks and service marks contained herein are the property of their respective owners. Unless otherwise specifically indicated, all information with respect to any third party not affiliated with NewEdge has been provided by, and is the sole responsibility of, such third party and has not been independently verified by NewEdge, its affiliates or any other independent third party. No representation is given with respect to its accuracy or completeness, and such information and opinions may change without notice.
Investing involves risk, including possible loss of principal. Past performance is no guarantee of future results.
Any forward-looking statements or forecasts are based on assumptions and actual results are expected to vary from any such statements or forecasts. No assurance can be given that investment objectives or target returns will be achieved. Future returns may be higher or lower than the estimates presented herein.
An investment cannot be made directly in an index. Indices are unmanaged and have no fees or expenses. You can obtain information about many indices online at a variety of sources including: https://www.sec.gov/answers/indices.htm.
All data is subject to change without notice.
© 2026 NewEdge Capital Group, LLC
