


And I don’t understand why I sleep all day
And I start to complain that there’s no rain
And all I can do is read a book to stay awake
And it rips my life away, but it’s a great escape
“No Rain”- Blind Melon
For much of the past two years, the bond market has been consistently expecting a much easier policy path than what the Fed has signaled and executed. Time and time again, the bond market has front run the Fed, expecting a shift to easier policy, but the Fed has not delivered. The reason the Fed has not moved to confirm the bond market’s dovish hopes is because the data has not supported a shift to easier policy, with economic data remaining resilient and stronger than forecasted.
Effectively, the bond market has been seeing the risk of an economic storm, but the data has been producing “no rain” (or at least just scattered clouds).
Once again, this week produced better-than-expected U.S. economic data: January’s U.S. Nonfarm Payrolls of 353k surprised significantly to the upside (consensus was for just 185k), while average hourly earnings were hotter than expected (+0.6% month-over-month, +4.5% year-over-year).
This data challenged the aggressive cutting path that was reflected in the pricing of Fed Funds Futures and sent yields jumping higher (complaining that there’s no rain!).
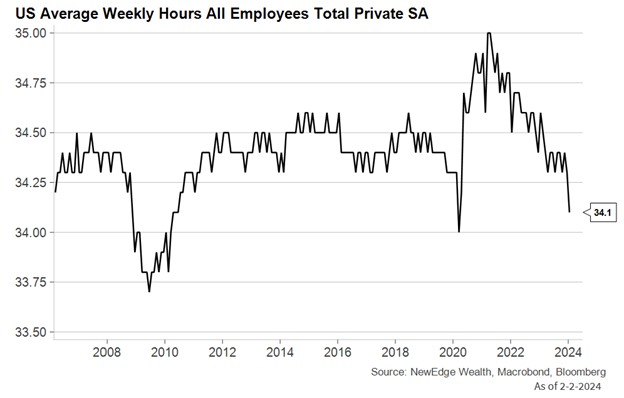
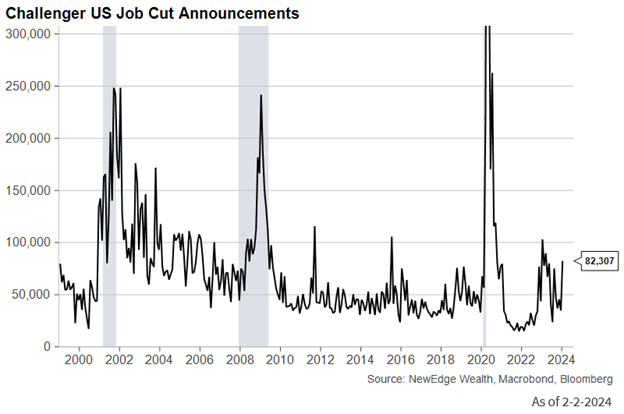
To be fair, we can poke at a few items in the report, such as a weaker Household Survey (-31k jobs) and a drop in Average Weekly Hours (34.1, the lowest level since the COVID lockdowns and the 2008 recession). Hours worked tend to drop when companies are looking to cut back on labor costs but may be hesitant to do large scale job reductions. Further, there were other weaker data points this week as well, such as Initial Claims and Challenger Job Cuts Announcements, that we must monitor.
However, even with these caveats, the strength of the data suggests that the U.S. economy remains resilient and that the expectation for an aggressive rate cutting path to commence imminently looks to be aggressive in its own right.
The Fed itself pushed back against the expectation for cuts to begin in March at this week’s meeting of the Federal Open Market Committee, with Chair Powell suggesting that the committee needed more data to give it confidence that it could cut rates without risking inflation’s return.
The data this week has further supported the Fed’s “wait and see” approach, with resilient labor data removing any urgency from the Fed to ease policy.
For markets, this data and Fed response has a few implications.
From a fixed income perspective, it likely puts upward pressure in the near term on short-and long-term yields, as cuts are priced out of the front end of the curve and demand for a “flight to safety” bid for the long end are reduced.
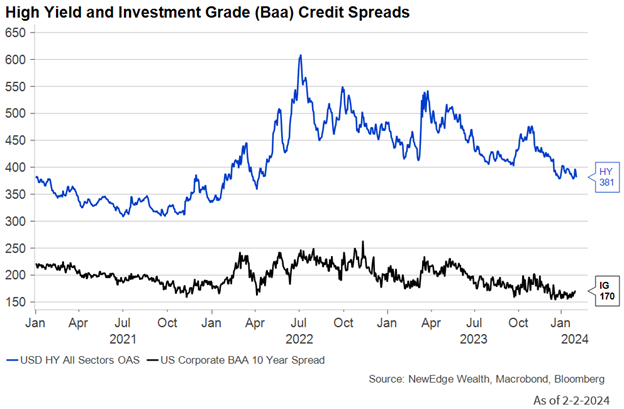
For credit, resilient data has continued to push spreads lower for investment grade and high yield bonds; however, complacency and an underpricing of risk will be a watch item for credit if data were to soften in the future.
For equities, resilient data helps to confirm equity earnings forecasts that never believed in the hard landing that the bond market feared (EPS estimates are for +10% in 2024 and +11% in 2025 for the S&P 500). The U.S. economy needs to remain resilient for this kind of earnings growth to materialize, so strong data serves to increase the probability that these forecasts are correct (however, as we noted last week, EPS forecasts have been getting trimmed all the while economic data has come in better than expected!).
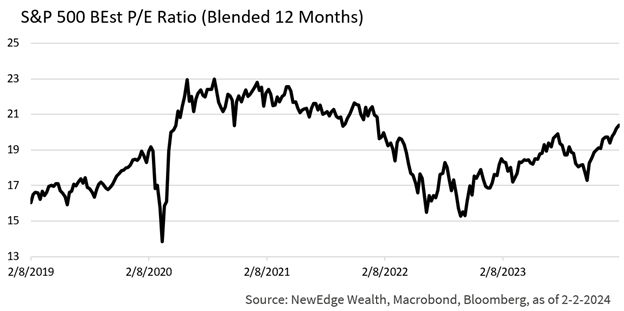
The tighter Fed could have important implications on valuations for equities, but this isn’t a direct line. Valuations have expanded materially since the October low (+17% for the S&P 500 to 20.4x forward), boosted by bets that the Fed would be easing policy in the near future, but also likely boosted by overall improved sentiment towards equities (and a positioning chase), as well as technology optimism. If yields were to continue to rise as the Fed pushes back on easing, this could pose a challenge for extended equity valuations.
Where we think the biggest unwind risk is for the parts of the equity market most sensitive to interest rates. Companies with weak balance sheets (high levels of debt, usage of floating rate debt, and weak cash flows to service debt) have seen large rebounds on the hopes of an easier Fed and lower yields, which could continue to be reversed as the pricing of Fed easing is unwound.
Overall, as we look at the data backdrop for the U.S. economy, we continue to see resilience, but with caveats of conflicting signals (though these are not large enough to suggest an imminent recession). All this is consistent with our expectation for a “strange landing” in 2024, which requires vigilance as we continue to monitor the data.
Top Points of the Week
By Austin Capasso and Ben Lope
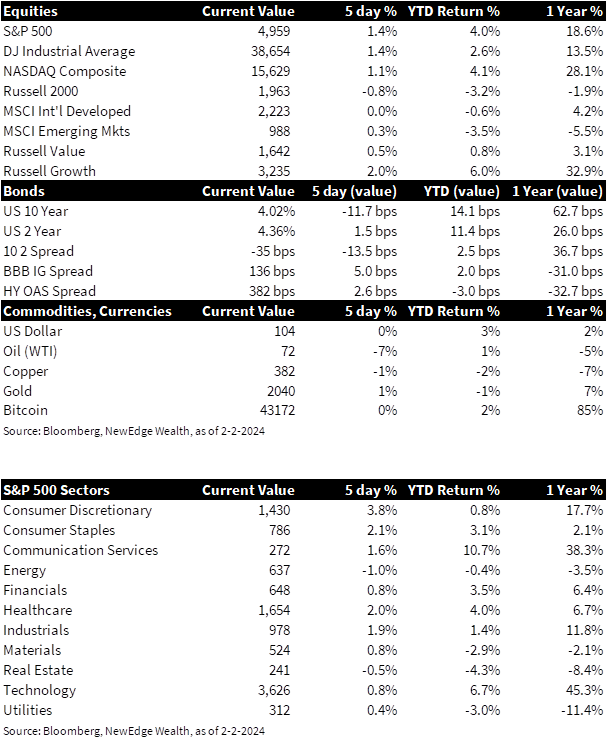
1. S&P 500 Reaches New All-Time High – The S&P 500 ended the week at an all-time high, just shy of 5,000. Other major US indices (NASDAQ Composite, Dow Jones Industrial Average) were also up on the week, while international stocks were more of a mixed bag. International developed markets equities were up ever so slightly, while international emerging markets equities fell nearly 1%.
2. Friday Job’s Report Moves Short Yields Higher – Yields across the curve moved lower throughout the week before spiking after Friday’s stronger than expected job’s report. Friday’s jump resulted in the yield on 2-year Treasury bonds to increase slightly on the week, while yields on 10-year Treasury bonds registered a decline of approximately 10bps throughout the week. Collectively, these moves resulted in the 2-10 year Treasury yield curve becoming more inverted.
3. Upside Surprise in January’s Jobs Report – The US economy added 353,000 jobs in January, which was well ahead of the 185,000 jobs expected. Job growth was well spread across sectors, with leisure and hospitality leading the pack after adding 140,000 jobs. The unemployment rate held at 3.7% against estimates for an increase to 3.8%. Average hourly earnings increased 0.6% on a monthly basis, which doubled the estimate of 0.3%. All in all, this was a big upside surprise and likely takes a rate cut in March off the table in decisive fashion. The Fed remain data dependent behind the fear that cutting rates too early could reignite inflation.
4. Fed Day Recap – The Fed left rates unchanged in January’s Federal Open Market Committee (FOMC) meeting on Wednesday. Jerome Powell and the Federal Reserve noted that it would not be appropriate to cut rates until they are certain that inflation is approaching their target of 2%. Powell reiterated their mandate of maximum employment and price stability. Economic data continues to come in better than expected, the jobs market remains strong, and the consumer continues to spend, which all points to a goldilocks environment in markets for the time being.
5. BOE Leaves Rates Unchanged in Divided Decision – The Bank of England, like the US Federal Reserve, left interest rates unchanged at 5.25%. The decision came with divided opinions among board members, where the Monetary Policy Committee (MPC) voted 6–3 in favor of holding rates steady, with two voters calling for a 25 basis point hike and one voter for a 25 basis point rate cut. This marked the first meeting since August 2008 that MPC members have voted to move interest rates in opposite directions at the same meeting. The goal of the committee is for inflation to return to their 2% target (UK Inflation is currently 4%).
6. Brazil and Other Central Banks Cut Rates – Three countries in Latin America, Brazil, Colombia, and Chile, all cut interest rates despite the Fed staying put. Brazil’s 50 basis point cut marks the fifth consecutive rate cut and promised to keep the same easing pace for the next two meetings, at least. Chile delivered a jumbo cut of 100 basis points while Colombia lowered rates by 25 basis points, both of which were split votes with the minority backing faster easing. This all points to US borrowing costs falling after March, where the probability of a rate cut by the Fed moved from 60% to 30% after the FOMC meeting Wednesday.
7. Next Week’s Marquee Earnings Reports – Next week’s earnings headline McDonald’s, Eli Lilly, Walt Disney, ConocoPhillips, and PepsiCo. This should give investors a better look into the spending of US consumers and the overall energy sector after a generally positive week from big tech earnings.
8. The Week Ahead – Next week’s economic calendar is relatively light compared to this week’s and will include the release of January ISM Services figures, a report on Consumer Credit in December of 2023, and speeches from three separate Fed members (Bostic, Mester, and Kugler).
IMPORTANT DISCLOSURES
Abbreviations/Definitions: BOE: Bank of England; EPS: earnings per share; FOMC: Federal Open Market Committee.
Index Information: All returns represent total return for stated period. S&P 500 is a total return index that reflects both changes in the prices of stocks in the S&P 500 Index as well as the reinvestment of the dividend income from its underlying stocks. Dow Jones Industrial Average (DJ Industrial Average) is a price-weighted average of 30 actively traded blue-chip stocks trading New York Stock Exchange and Nasdaq. The NASDAQ Composite Index measures all NASDAQ domestic and international based common type stocks listed on the Nasdaq Stock Market. Russell 2000 is an index that measures the performance of the small-cap segment of the U.S. equity universe. MSCI International Developed measures equity market performance of large, developed markets not including the U.S. MSCI Emerging Markets (MSCI Emerging Mkts) measures equity market performance of emerging markets. Russell 1000 Growth Index measures the performance of the large- cap growth segment of the US equity universe. It includes those Russell 1000 companies with relatively higher price-to-book ratios, higher I/B/E/S forecast medium term (2 year) growth and higher sales per share historical growth (5 years). The Russell 1000 Value Index measures the performance of the large cap value segment of the US equity universe. It includes those Russell 1000 companies with relatively lower price-to-book ratios, lower I/B/E/S forecast medium term (2 year) growth and lower sales per share historical growth (5 years). The BBB IG Spread is the Bloomberg Baa Corporate Index that measures the spread of BBB/Baa U.S. corporate bond yields over Treasuries. The HY OAS is the High Yield Option Adjusted Spread index measuring the spread of high yield bonds over Treasuries.
Sector Returns: Sectors are based on the GICS methodology. Returns are cumulative total return for stated period, including reinvestment of dividends.
The views and opinions included in these materials belong to their author and do not necessarily reflect the views and opinions of NewEdge Capital Group, LLC.
This information is general in nature and has been prepared solely for informational and educational purposes and does not constitute an offer or a recommendation to buy or sell any particular security or to adopt any specific investment strategy.
NewEdge and its affiliates do not render advice on legal, tax and/or tax accounting matters. You should consult your personal tax and/or legal advisor to learn about any potential tax or other implications that may result from acting on a particular recommendation.
The trademarks and service marks contained herein are the property of their respective owners. Unless otherwise specifically indicated, all information with respect to any third party not affiliated with NewEdge has been provided by, and is the sole responsibility of, such third party and has not been independently verified by NewEdge, its affiliates or any other independent third party. No representation is given with respect to its accuracy or completeness, and such information and opinions may change without notice.
Investing involves risk, including possible loss of principal. Past performance is no guarantee of future results.
Any forward-looking statements or forecasts are based on assumptions and actual results are expected to vary from any such statements or forecasts. No assurance can be given that investment objectives or target returns will be achieved. Future returns may be higher or lower than the estimates presented herein.
An investment cannot be made directly in an index. Indices are unmanaged and have no fees or expenses. You can obtain information about many indices online at a variety of sources including: https://www.sec.gov/answers/indices.htm.
All data is subject to change without notice.
© 2026 NewEdge Capital Group, LLC

