


Here we stand,
Worlds apart
-Journey, “Separate Ways”
The music video for Journey’s 1983 song “Separate Ways” is well known to be iconically cringe-worthy. It has everything you would expect from an early 80’s music video: dramatic closeups shot in profile, teased-out mullets, cut-off muscle tees, and, to really put it over the edge, air guitar (this last point got the video voted MTV’s 13th worst music video of all time in 1999).
Though strong rallies in broad equity market indices to start 2024 are hardly wince-inducing like Journey’s music video, under the surface, we have continued to see a stark divergence between market leaders and laggards, with a notable continuation of 2023’s leadership profile to start 2024. We think this performance is due to earnings revisions going separate ways.
Losing Ground, I’m Reaching for You: EPS Revisions Explain Stock Leadership
Contrary to the many calls for leadership rotations and a broadening out of the market, 2024’s market dynamics has been more of the same: Growth/Technology leads, while Value/Equal Weight/Small Cap/Non-U.S. lags.
As we highlighted in our deep dive on Growth vs. Value at the beginning of the year, as well as in our 2024 Outlook, there are plenty of reasons to see potential for leadership rotations in favor of recent laggards, such as valuation discounts and less-crowded positioning; however, there is one KEY thing that lagging sectors/styles do not have that leading sectors do: positive earnings revisions.
Those areas of the market with positive earnings revisions (analysts raising estimates) have led, while those with negative earnings revisions (analysts cutting estimates) have lagged (we could take the analogy one step further by saying broad parts of the market are “playing air guitar”, not contributing to the overall “song” of earnings growth, but that would be bridge too far, even for us).
Different parts of the market have truly gone separate ways when it comes to earnings revisions, and we think a change in these earnings revision trends is likely necessary to see a change in stock market leadership as well, making these must-watch metrics. The starkest example of earnings revisions driving relative performance is with small cap stocks, where over the last year, analysts have cut estimates for Russell 2000 2024 EPS by 20%, while S&P 500 EPS estimates have seen little change. In this same timeframe, the S&P 500 outperformed the Russell 2000 by 20%.
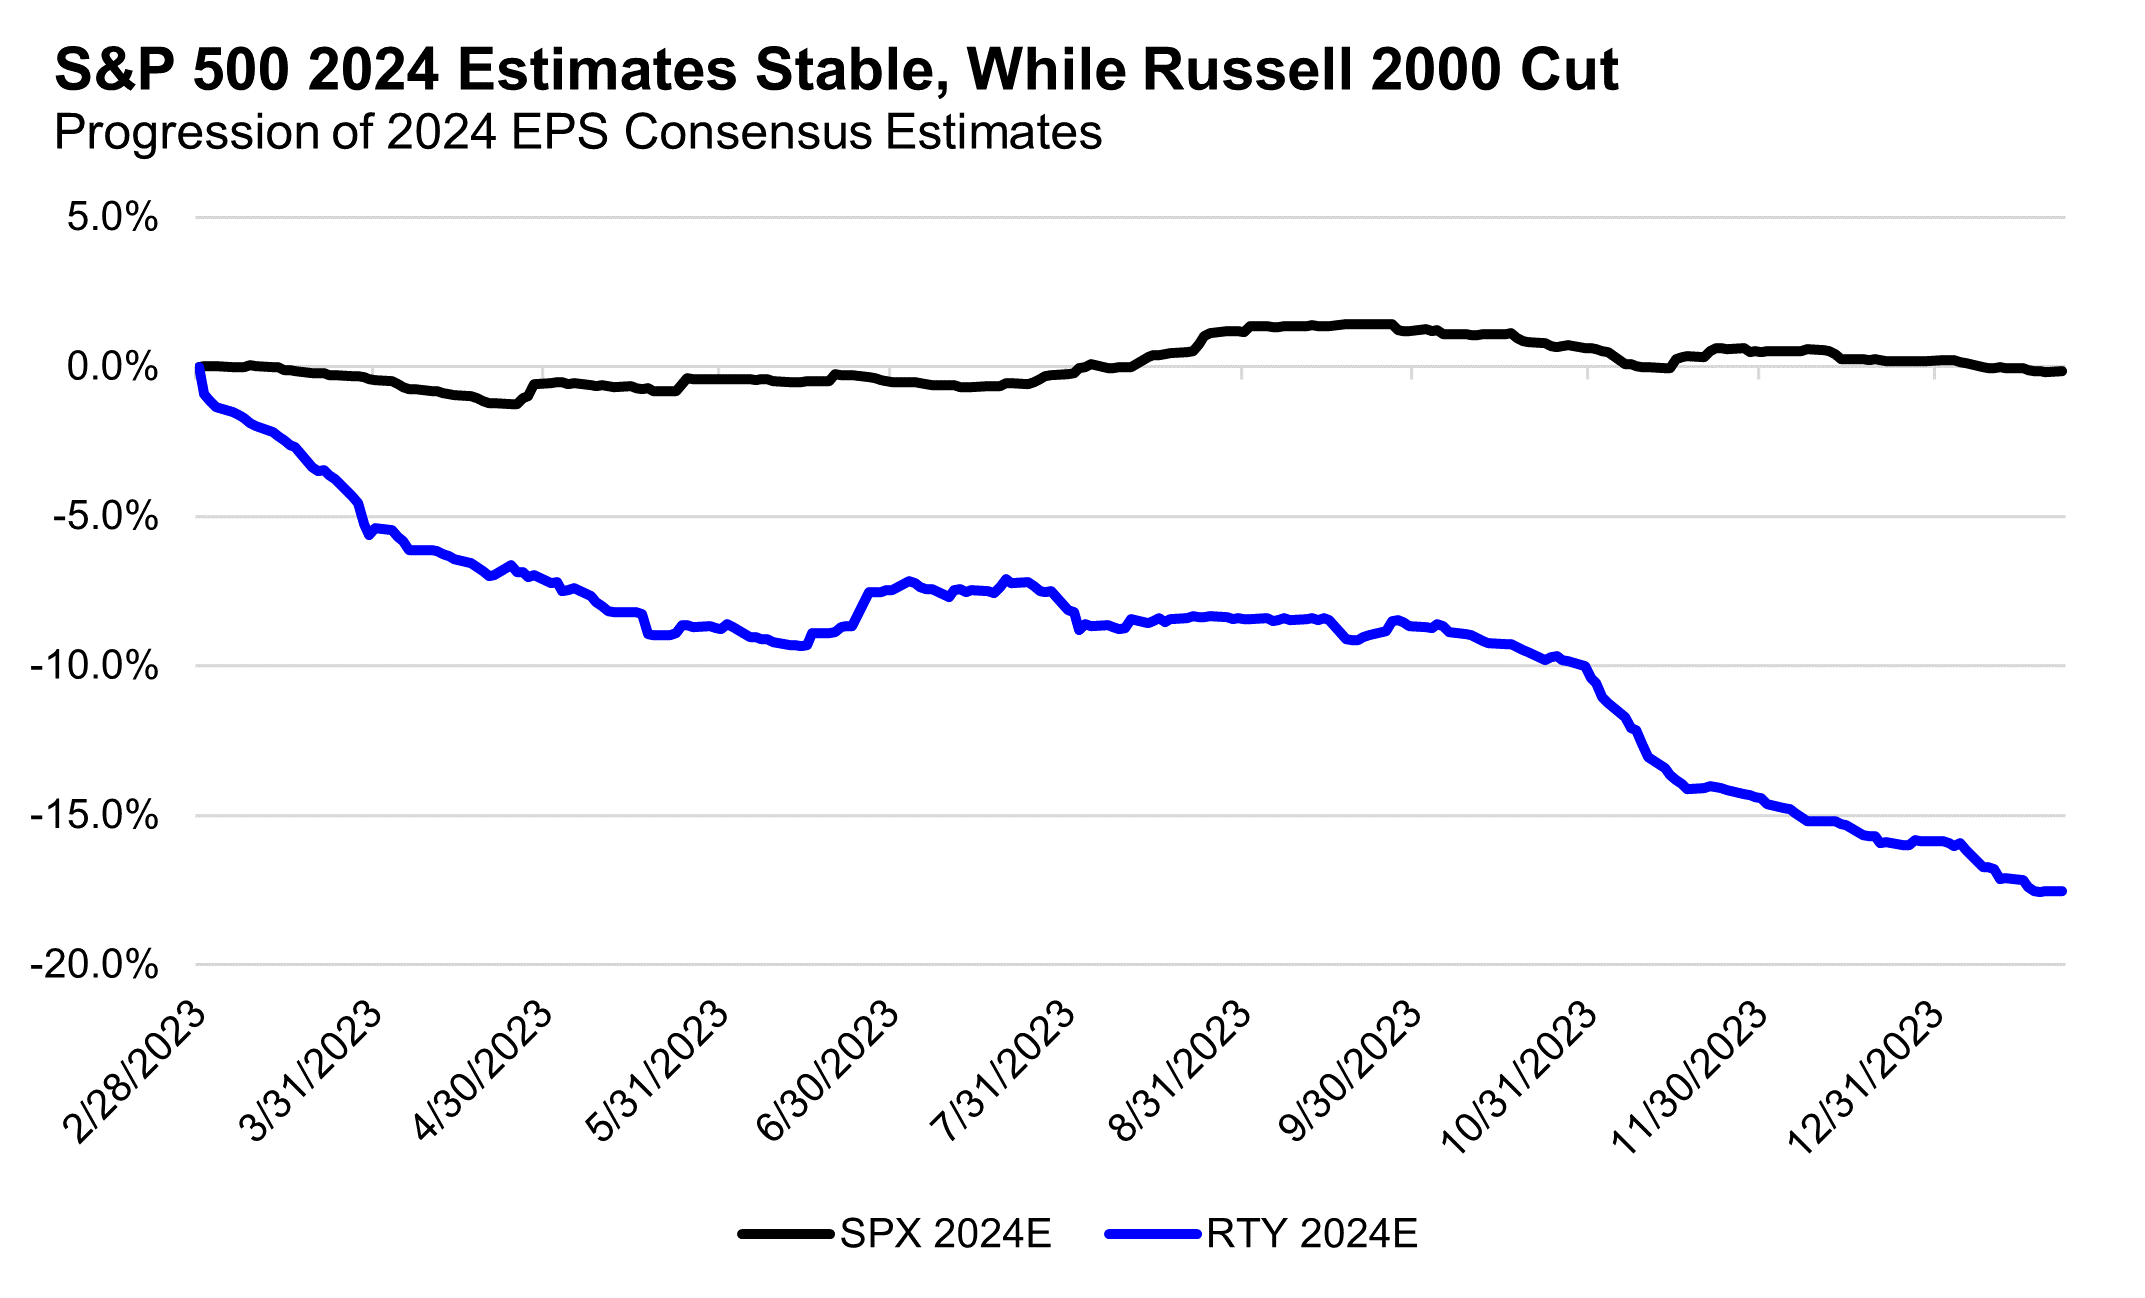
Note how the EPS estimates revisions accelerated in 4Q23, while small cap stocks were rallying and interest rates were falling (interest rates are an important driver of broad small caps because of high floating rate debt exposure).
We could spin this positively by arguing that small EPS estimates cuts at least create a lowered bar for upside surprises in the future; however, for improved small cap performance to be sustained, we likely need to see estimates begin to get revised higher and not lower.
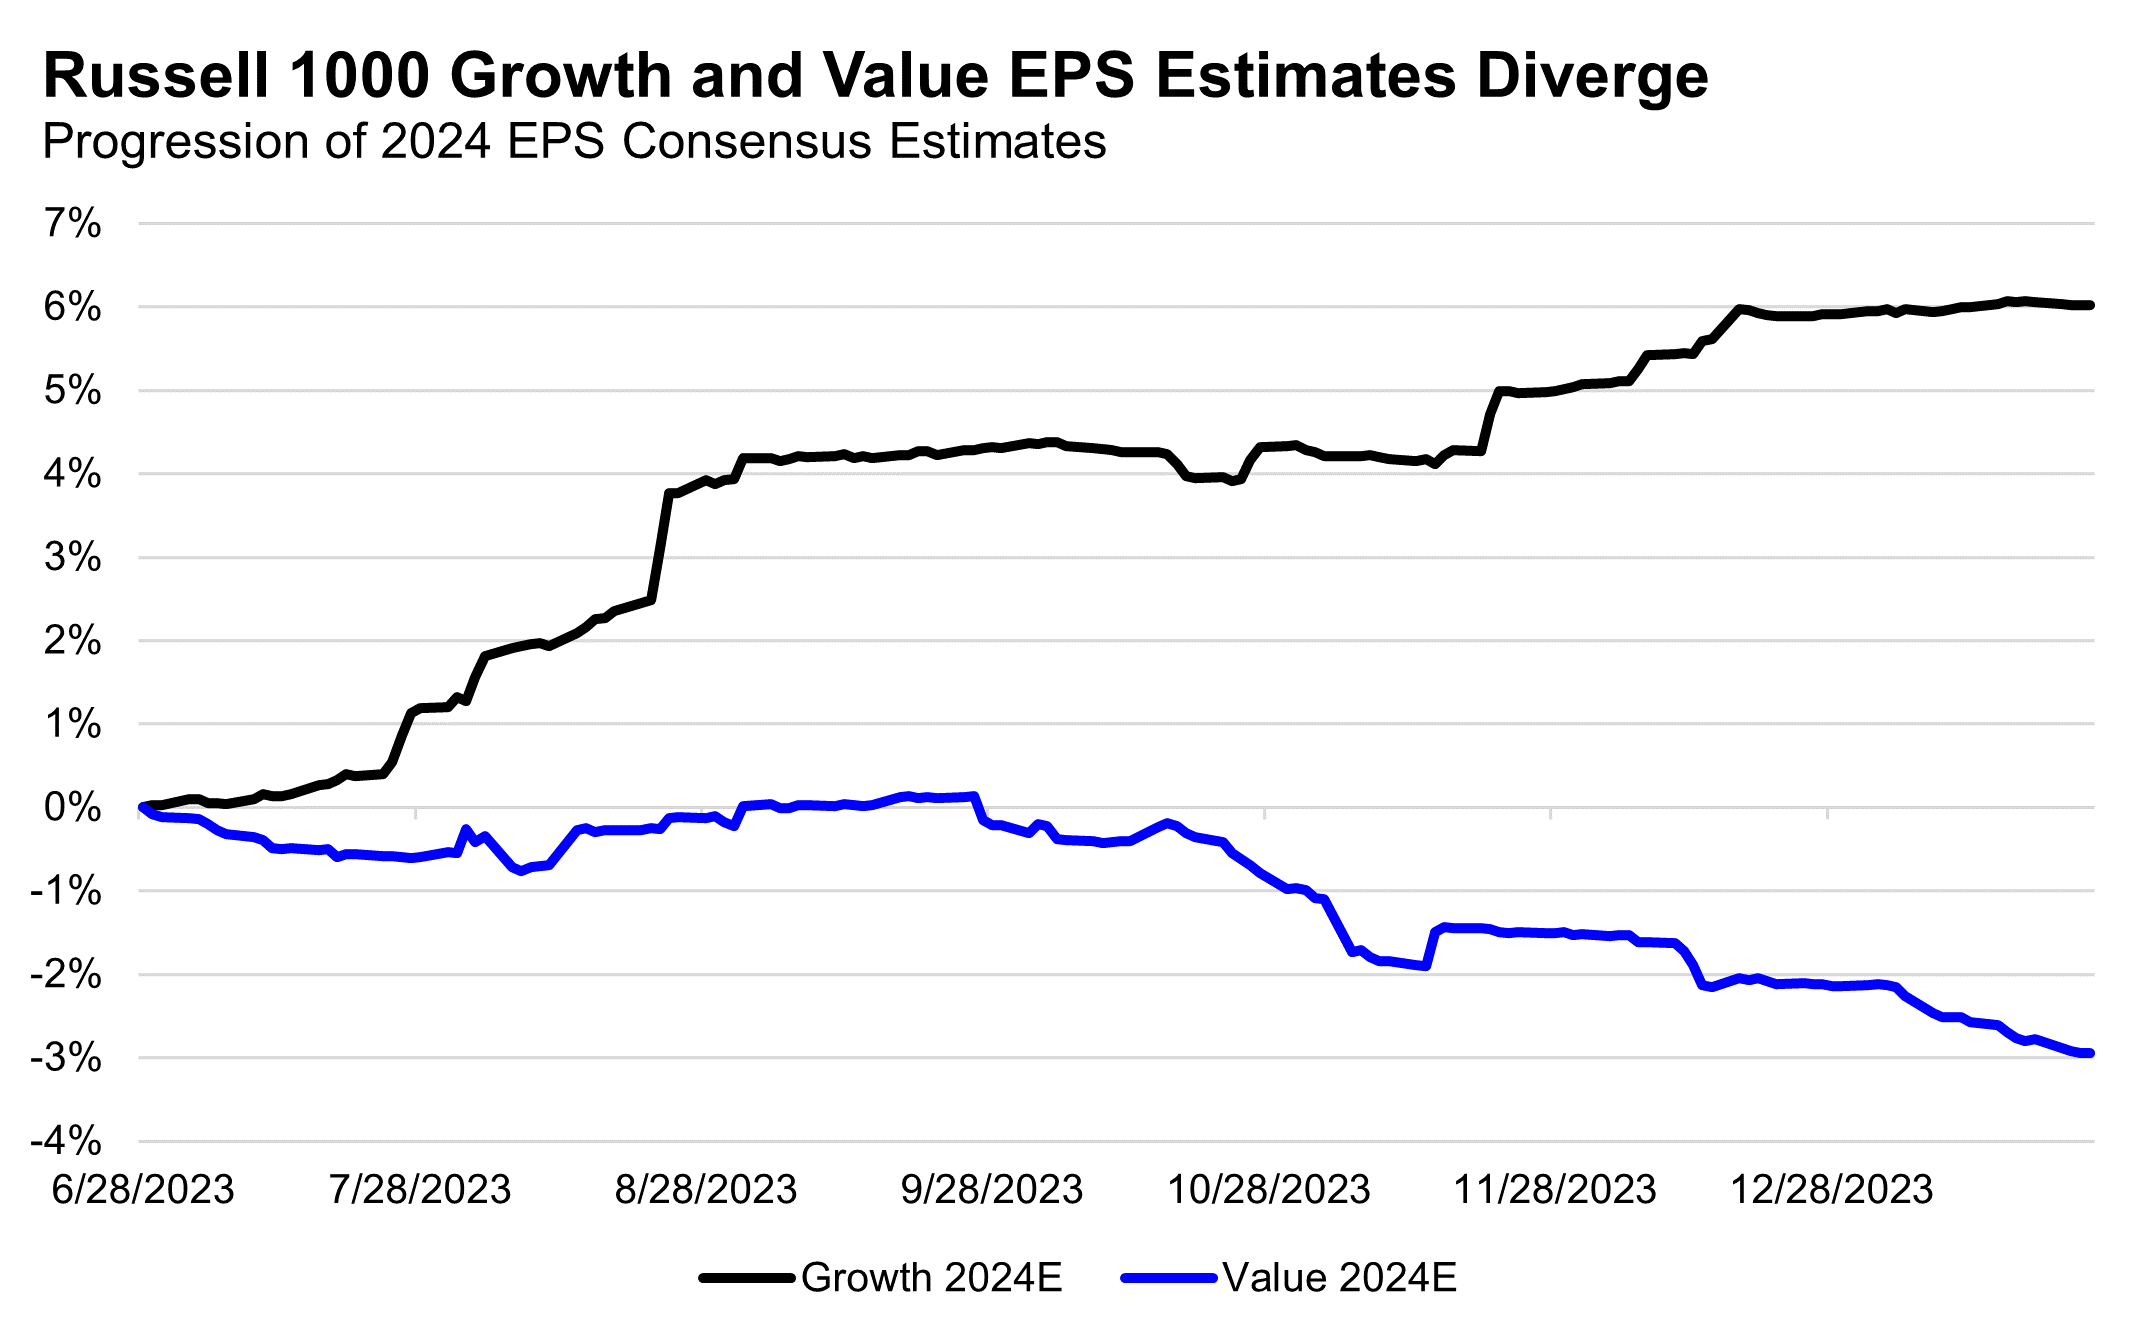
Earnings revisions going separate ways also explains the Growth vs. Value trade, where Growth has dominated Value thanks to multiple expansion and earnings revisions. Over the last seven months, Growth EPS has been revised higher by 5%, while Value EPS has been revised lower by 3%. In this time Growth outperformed Value by 10% (using Russell 1000 Growth and Value indices).
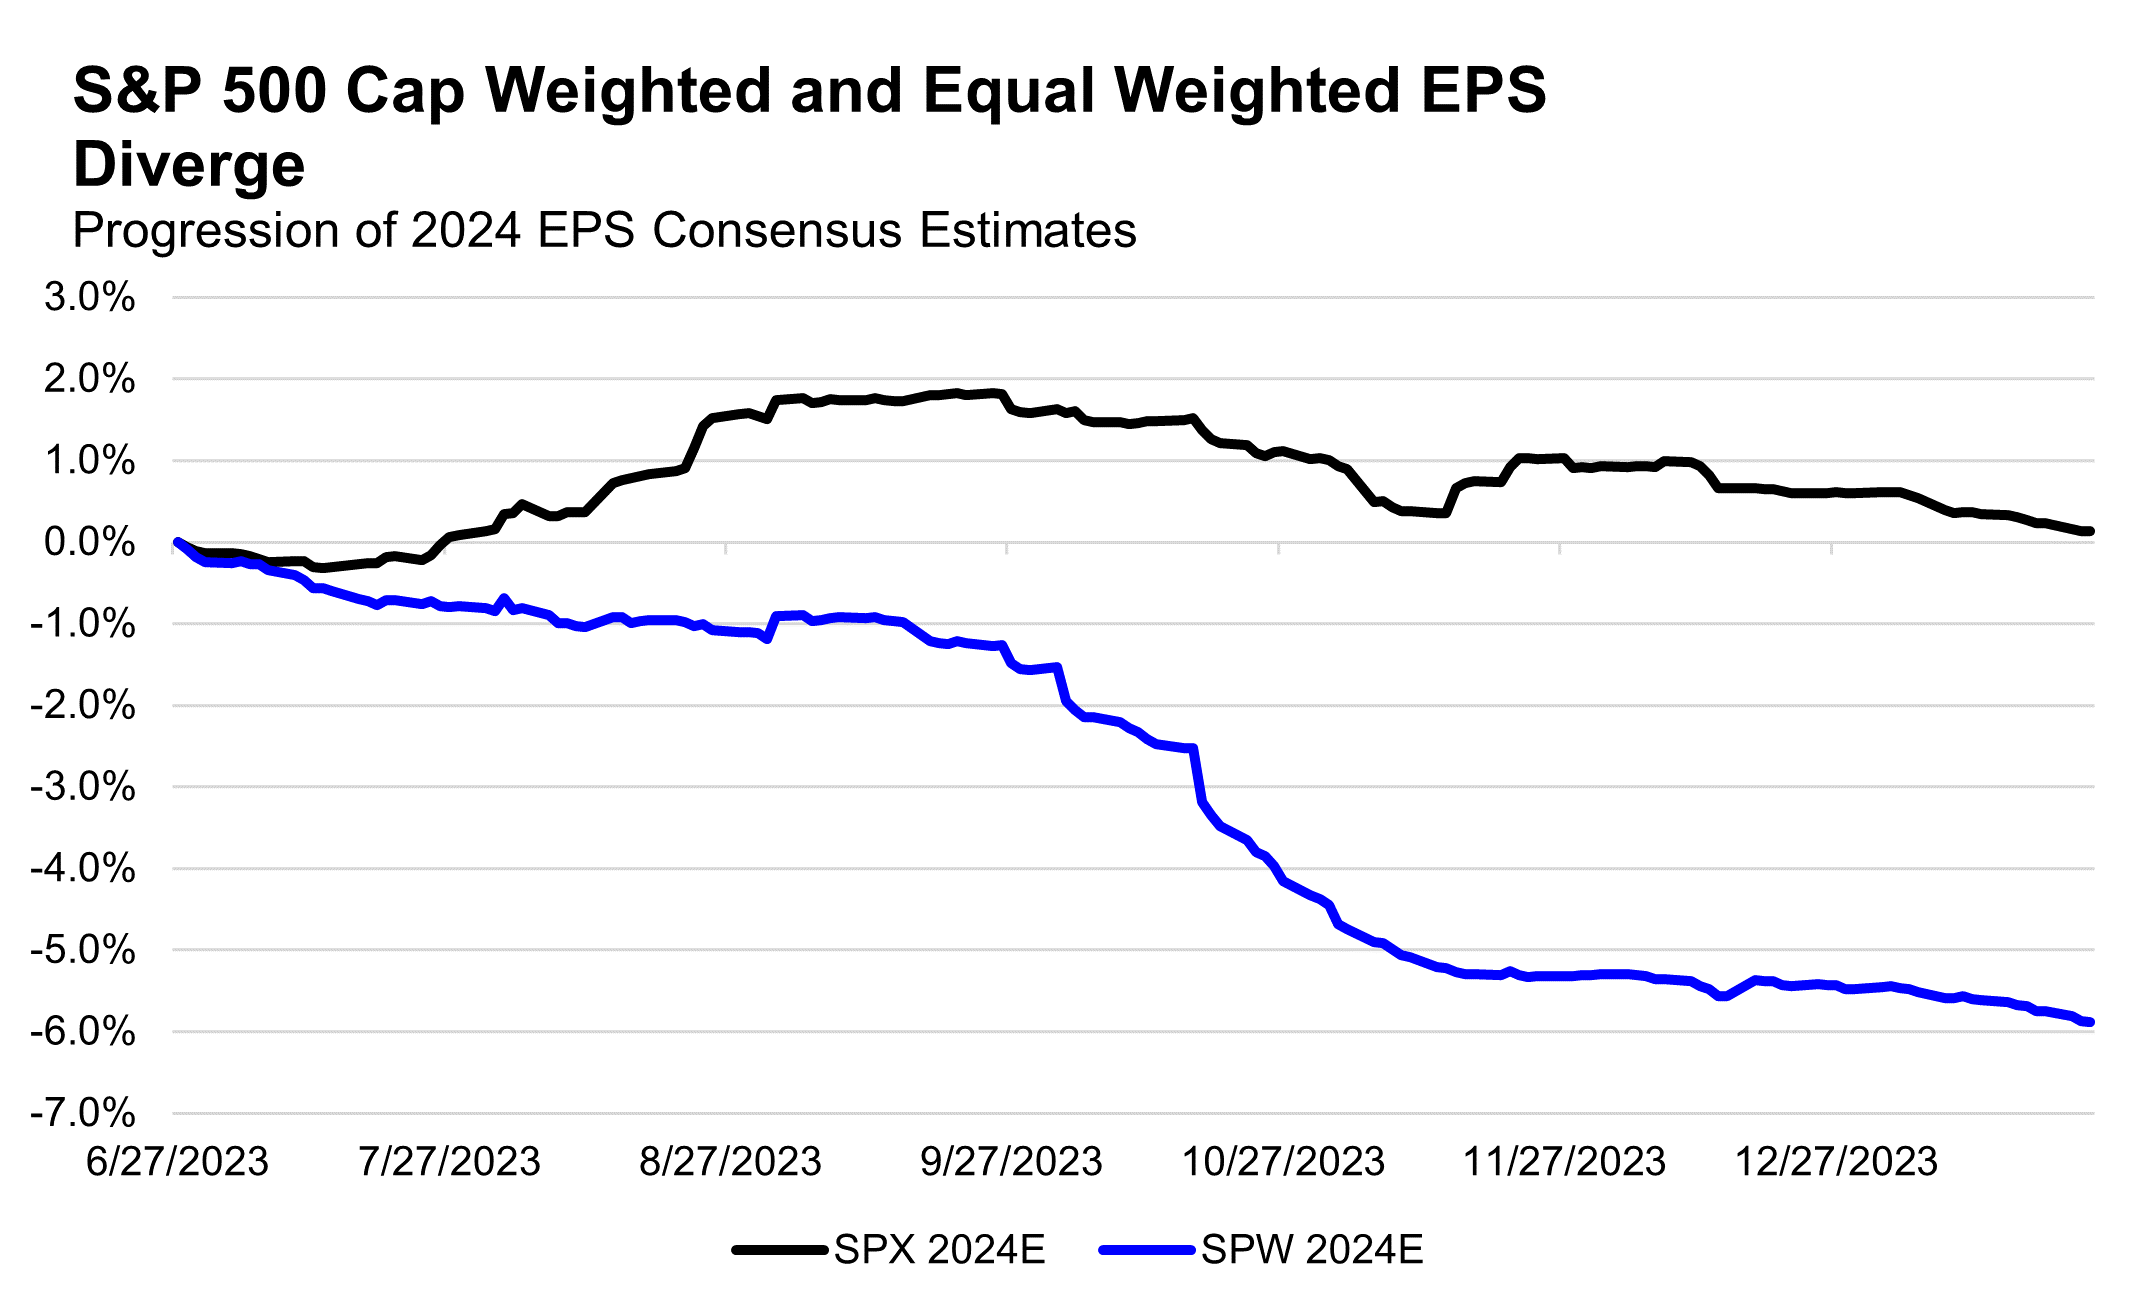
For those hoping for a broader market in 2024, with better performance of the Equal Weight S&P 500, the separate ways dynamic of EPS revisions is relevant as well. As cap weighted S&P 500 EPS revisions have remained flat over the last 7 months, the Equal Weight S&P 500 has seen its 2024 EPS estimates get trimmed by -7%.
This speaks to the market having narrow leadership for a reason: earnings revisions have also been narrow, with the largest names experiencing EPS revisions up, which offset EPS revisions down in the rest of the index (no “air guitar” for the Magnificent 7/big-Tech/Growth names!).
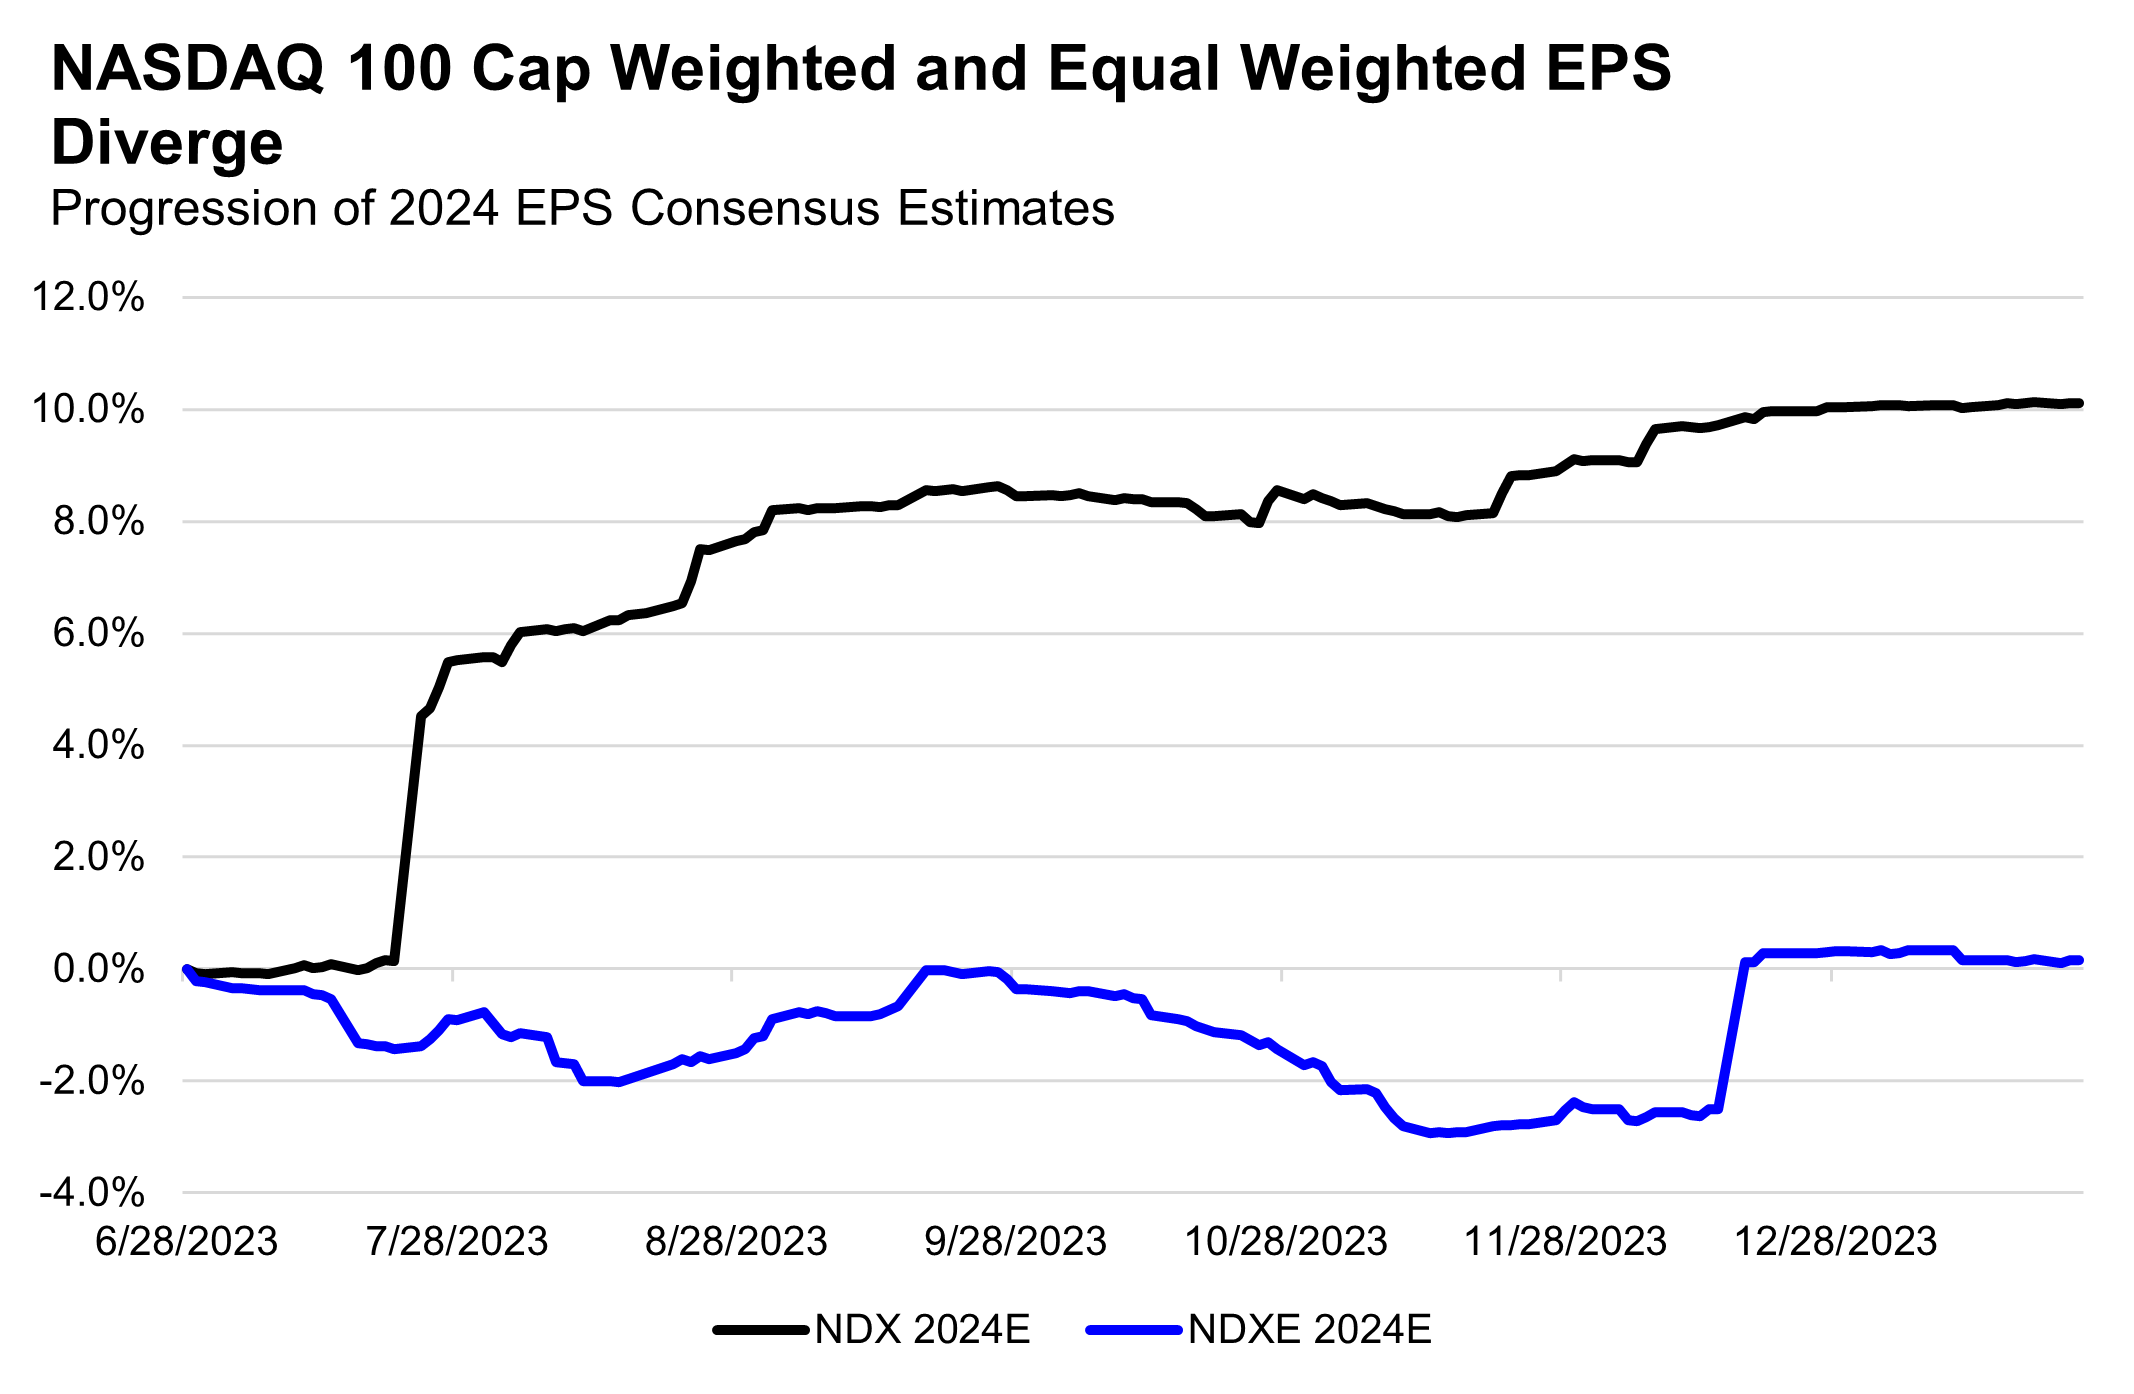
Interestingly, even with Tech/Growth-oriented indices like the NASDAQ 100 (NDX), the earnings revisions have been narrow. The highly concentrated NASDAQ 100 has seen a big uplift to its EPS estimates, while the equal weighted version (NDXE) has seen estimates about flat (a lot of this can be attributed to the big upside to EPS estimates for large semi-conductor stocks). So even within Tech/Growth, it is lonely at the top!
Note that this EPS revision divergence between NDX and NDXE did not lead to a big performance divergence over the last 7 months (NDX +16%, NDXE +13%), likely thanks to large PE multiple expansion from stocks in the index that did not see EPS revised higher.
The implication of these separate ways dynamics is that we likely need to see EPS revisions broaden out if we are to see equity performance broaden out. We note that price does typically lead data (the market moves before earnings catch up), but for future rotations to be sustainable, we likely need to see laggard-stock EPS revisions turn higher, or leader-stock EPS revisions turn lower (the conditions for this are a separate discussion).
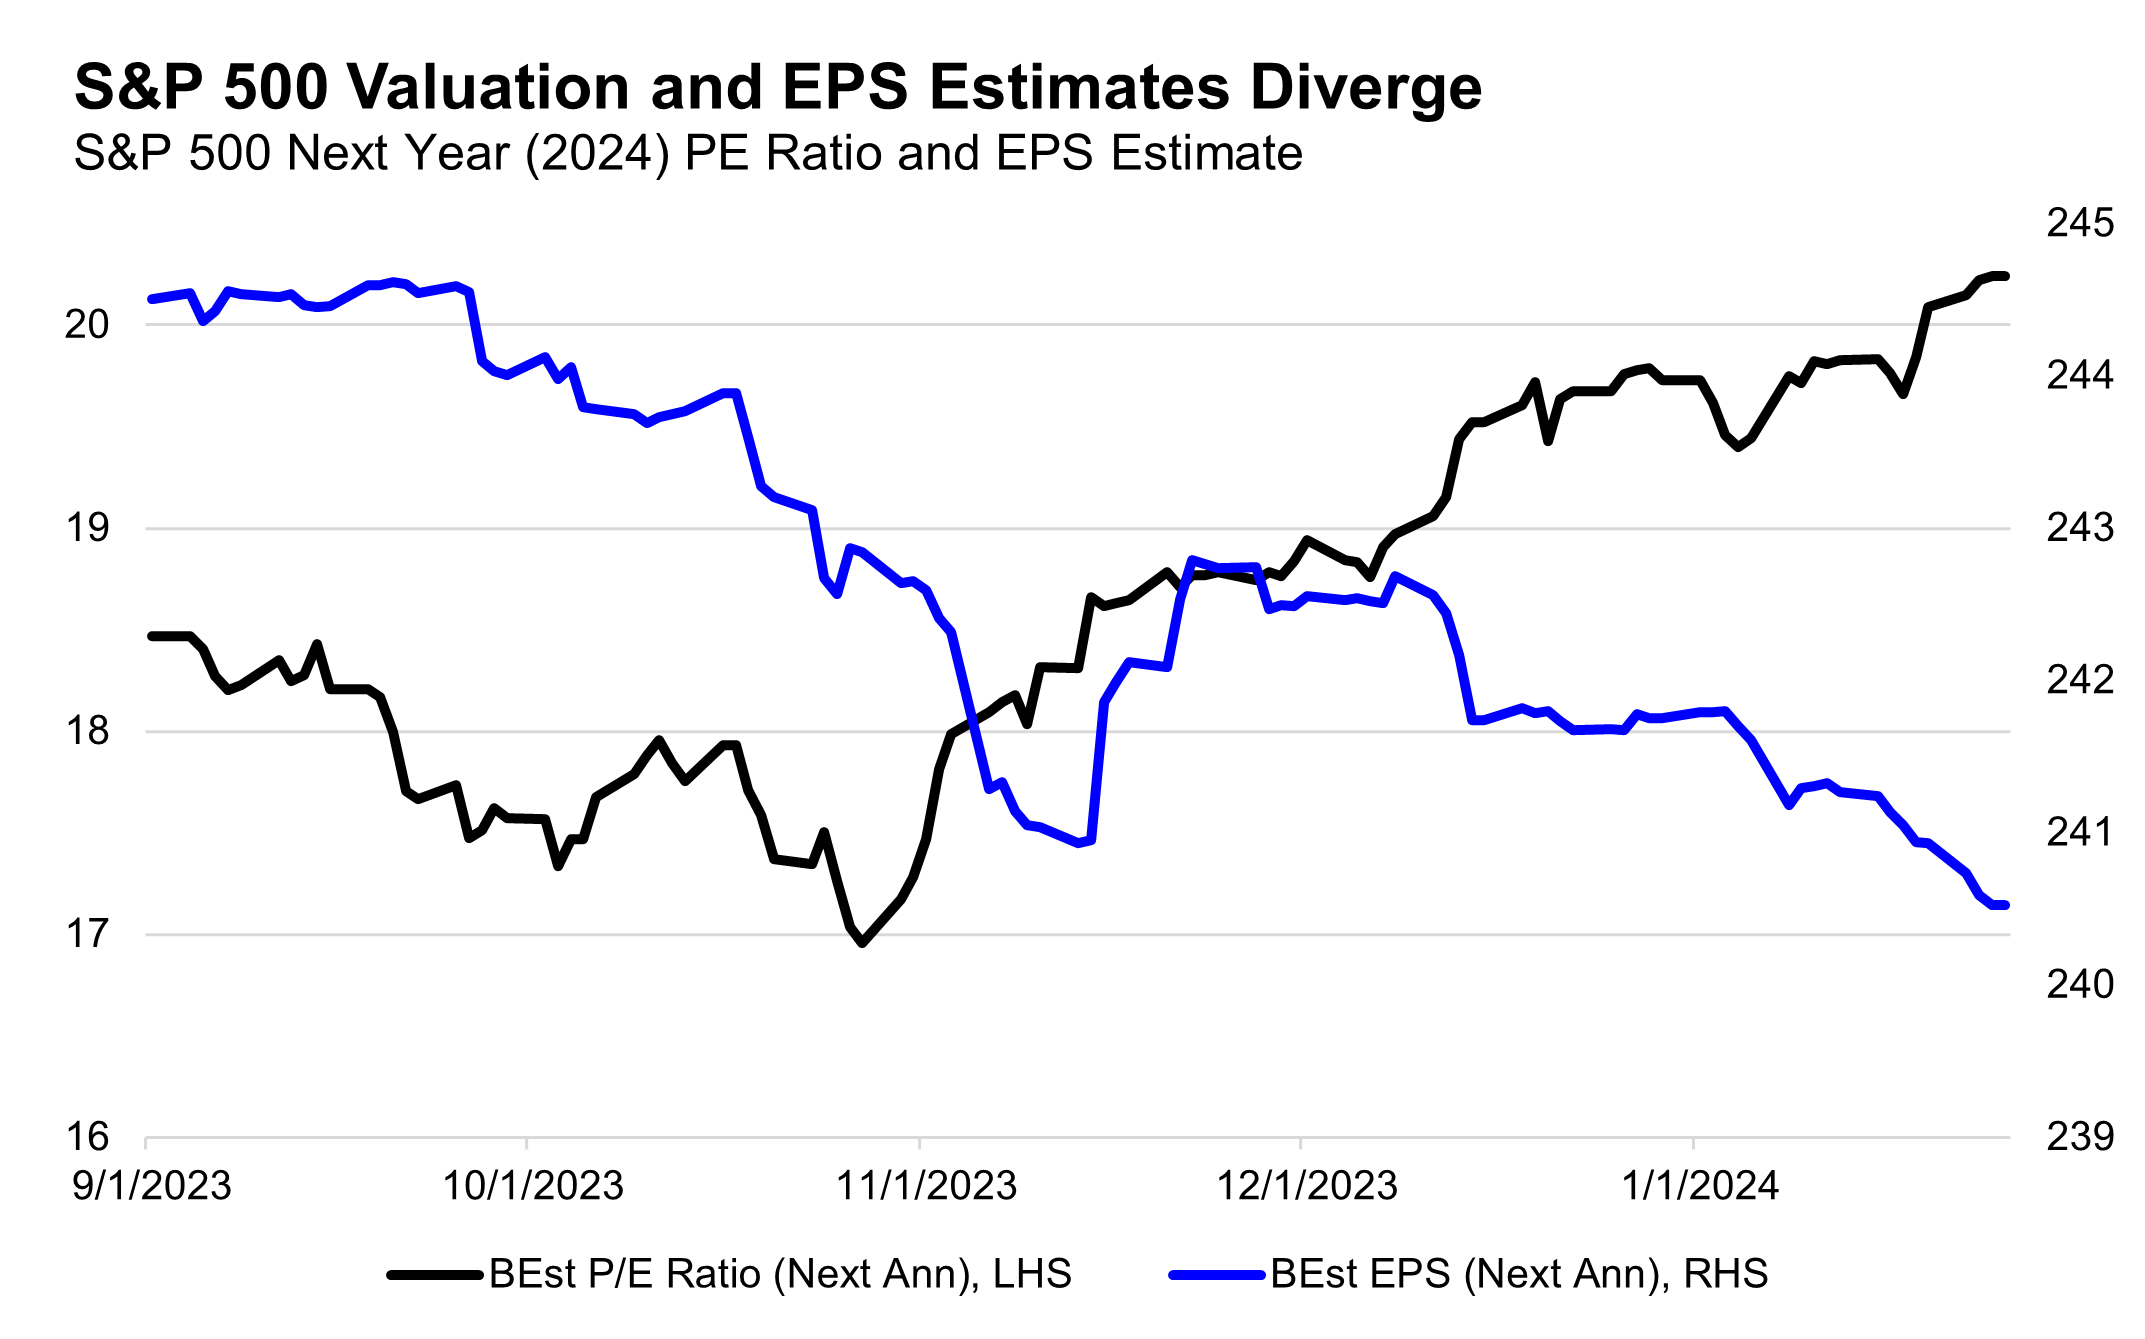
Lastly, there is one other separate ways dynamic that must be noted in this equity market, which is the divergence of earnings estimates and valuations over the past four months.
As equities have staged large rallies coming out of the October 2023 lows, the sole driver of this rally from the S&P 500 level has been PE multiple expansion, as EPS estimates for the S&P 500 have been revised slightly lower over the past four months (-0.2%).
This downward pressure on EPS estimates, though slight, is interesting in the context of economic forecasts that have been revised meaningfully higher (look at this week’s 3.3% 4Q24 GDP vs. 2% estimates!) and growth sentiment that has improved materially in this same four-month time period (consensus is now for “soft landing nirvana”).
This could simply be a reflection of 2024 and 2025 EPS estimates already pricing in a strong economic backdrop, with an acceleration in top line revenue growth embedded in the 10%+ EPS growth forecast for each year. We’ve said it for some time, economists might have worried about a recession, but EPS forecasts did not reflect this worry.
As mentioned above, these revisions lower could be creating a lower bar for 2024 EPS upside surprises over the course of 2024, while higher PEs could also be front-running improved EPS in the future (remember, prices lead data).
However, it will be important to monitor EPS estimates for 2024 and 2025 because the longer they remain in a period of downward revisions, the more precarious, or air guitar-like this valuation driven rally will look (and if Journey’s “Separate Ways” video taught us anything, the critics do not like air guitar!).
Top Points of the Week
By Austin Capasso and Ben Lope
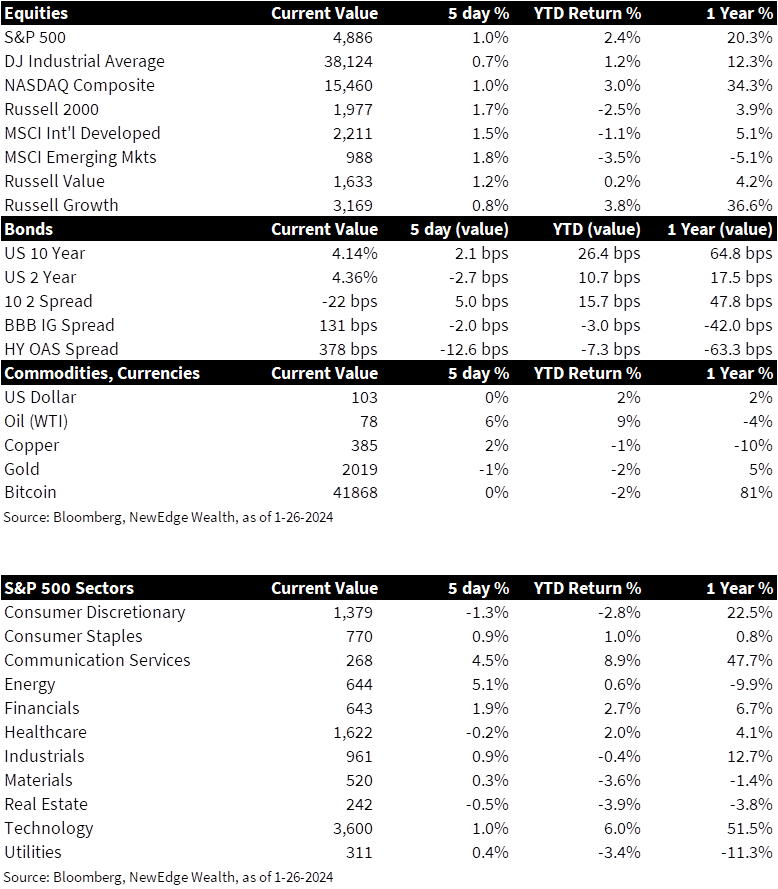
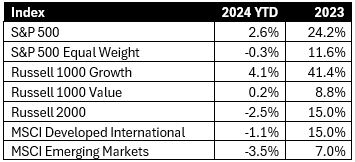
1. Global Equities Move Higher – Globalequities were broadly higher on the week. Within the US, small caps (as measured by the Russell 2000 index) led large caps (as measured by the S&P 500, Dow Jones Industrial Average, and NASDAQ Composite) and the Russell 1000 Value index slightly outpaced the Russell 1000 Growth index. Emerging markets equities edged out their developed markets peers, but both indices were up 1.5% or higher on the week.
2. Yield Curve Inches Closer to Flat – The yieldcurve moved closer to flat this week, with the degree of inversion decreasing from near 30bps to just above 20bps. This move was almost equally attributable to short rates moving lower as it was to long rates moving higher, as the yield on 2 year Treasuries decreased by about as much as the yield on 10 year Treasuries increased.
3. Q4 2023 US GDP Surprises to the Upside – In the fourth quarter of 2023, the US gross domestic product (GDP) increased at a 3.3% annualized rate while expectations called for 2%. Underlying components of the GDP price index and GDP deflator were both below the Fed’s target, which is a step in the right direction. Strength in consumer and government spending helped to drive the expansion for the quarter.
4. US PCE Data Release – December’sUS Core Consumer Consumption Expenditures Price Index (PCE), the Fed’s preferred measure of inflation, which excludes food and energy, increased 0.2% on the month and rose 2.9% on an annual basis versus expectations for 0.2% and 3.0%, respectively. Consumer spending increased 0.7%, stronger than the 0.5% estimate, which likely helped the upside surprise in the Q4 GDP release. The market reaction was somewhat muted, but overall, this reflects the strength and resilience of the US economy.
5. European PMI Data Release for December – The European Purchasing Managers Index(PMI)showed business activity in the Eurozone contracting for the eighth consecutive month, although the manufacturing outlook did improve. The services industry declined at a faster pace than last month. The release exemplifies the Eurozone’s recent struggles and indicates that the slowdown of their economy will continue for longer than anticipated by economists on the street.
6. ECB Leaves Rates Unchanged – The European Central Bank (ECB) left their key central rate unchanged at a record 4% for the third consecutive meeting. This move was widely expected by economists in attempt for the ECB to bring the Eurozone’s inflation rate below its 2% target. President of the ECB, Christine Lagarde, reiterated her reluctance to start on interest cuts despite pressure to do so.
7. China Stimulus Package – In an attempt to boost market confidence, the People’s Bank of China (PBOC) will enact a 50bps cut to the required level of cash reserves banks must hold in early February. In addition to the stimulative measures announced by the PBOC, a Bloomberg report on Tuesday cited that Chinese authorities intend to inject the equivalent of $287 billion into Chinese equity markets using offshore balances held by state-owned companies. This process would likely occur over several months and not comprise a significant fraction of trading volume; however, this is yet another sign of China’s efforts to stem decreases in its GDP growth rate, which registered 5.2% in 2023.
8. Earnings Reports to Come – Next week’s earnings is one of the most anticipated for investors. Earnings announcements from Google (GOOGL), Microsoft (MSFT), Amazon (AMZN), and Apple (AAPL) are some of the marquee names. This should give investors an outlook on the tech sector, and particularly the progress of artificial intelligence. We will be watching these announcements closely for any movements in the market, especially considering that these names make up such large weightings across major indices.
9. The Week Ahead – Thebiggest event for markets next week is the two-day FOMC meeting that begins on Tuesday. Markets have effectively priced out any chance of a rate cut at this meeting, but Powell’s comments during Wednesday’s press conference are sure to be closely parsed. Beyond the Fed meeting, major economic announcements next week include January Consumer Confidence figures, December ADP employment data, January Manufacturing PMIs, and to cap off the week, the January Employment Situation Summary report from the BLS (more colloquially known as “Jobs Friday”).
IMPORTANT DISCLOSURES
Abbreviations/Definitions: ECB: European Central Bank; EPS: earnings per share; FOMC: Federal Open Market Committee; PBOC: People’s Bank of China; PCE: personal consumption expenditures; PE: price to earnings ratio, the ratio of share price of a stock to its EPS; PMI: Purchasing Managers’ Index.
Index Information: All returns represent total return for stated period. S&P 500 is a total return index that reflects both changes in the prices of stocks in the S&P 500 Index as well as the reinvestment of the dividend income from its underlying stocks. Dow Jones Industrial Average (DJ Industrial Average) is a price-weighted average of 30 actively traded blue-chip stocks trading New York Stock Exchange and Nasdaq. The NASDAQ Composite Index measures all NASDAQ domestic and international based common type stocks listed on the Nasdaq Stock Market. Russell 2000 is an index that measures the performance of the small-cap segment of the U.S. equity universe. MSCI International Developed measures equity market performance of large, developed markets not including the U.S. MSCI Emerging Markets (MSCI Emerging Mkts) measures equity market performance of emerging markets. Russell 1000 Growth Index measures the performance of the large- cap growth segment of the US equity universe. It includes those Russell 1000 companies with relatively higher price-to-book ratios, higher I/B/E/S forecast medium term (2 year) growth and higher sales per share historical growth (5 years). The Russell 1000 Value Index measures the performance of the large cap value segment of the US equity universe. It includes those Russell 1000 companies with relatively lower price-to-book ratios, lower I/B/E/S forecast medium term (2 year) growth and lower sales per share historical growth (5 years). The BBB IG Spread is the Bloomberg Baa Corporate Index that measures the spread of BBB/Baa U.S. corporate bond yields over Treasuries. The HY OAS is the High Yield Option Adjusted Spread index measuring the spread of high yield bonds over Treasuries.
Sector Returns: Sectors are based on the GICS methodology. Returns are cumulative total return for stated period, including reinvestment of dividends.
The views and opinions included in these materials belong to their author and do not necessarily reflect the views and opinions of NewEdge Capital Group, LLC.
This information is general in nature and has been prepared solely for informational and educational purposes and does not constitute an offer or a recommendation to buy or sell any particular security or to adopt any specific investment strategy.
NewEdge and its affiliates do not render advice on legal, tax and/or tax accounting matters. You should consult your personal tax and/or legal advisor to learn about any potential tax or other implications that may result from acting on a particular recommendation.
The trademarks and service marks contained herein are the property of their respective owners. Unless otherwise specifically indicated, all information with respect to any third party not affiliated with NewEdge has been provided by, and is the sole responsibility of, such third party and has not been independently verified by NewEdge, its affiliates or any other independent third party. No representation is given with respect to its accuracy or completeness, and such information and opinions may change without notice.
Investing involves risk, including possible loss of principal. Past performance is no guarantee of future results.
Any forward-looking statements or forecasts are based on assumptions and actual results are expected to vary from any such statements or forecasts. No assurance can be given that investment objectives or target returns will be achieved. Future returns may be higher or lower than the estimates presented herein.
An investment cannot be made directly in an index. Indices are unmanaged and have no fees or expenses. You can obtain information about many indices online at a variety of sources including: https://www.sec.gov/answers/indices.htm.
All data is subject to change without notice.
© 2026 NewEdge Capital Group, LLC
