


Here I am expecting
Just a little bit too much from the wounded
but I see, see through it all
See through, see you
“3 Libras”, A Perfect Circle
Before we begin, mark your calendars and please join us for our 2024 Outlook Webinar on January 17th at 4 PM ET. You can sign up by clicking this link here.
3 Libras: A Triple Top for Growth vs. Value?
Note: All references to Growth and Value indices are to the Russell 1000 Growth and Russell 1000 Value indices unless otherwise noted.
Growth stocks had an incredible 2023. The Russell 1000 Growth index rallied +41.4% in 2023, beating the Value index by over 31%.
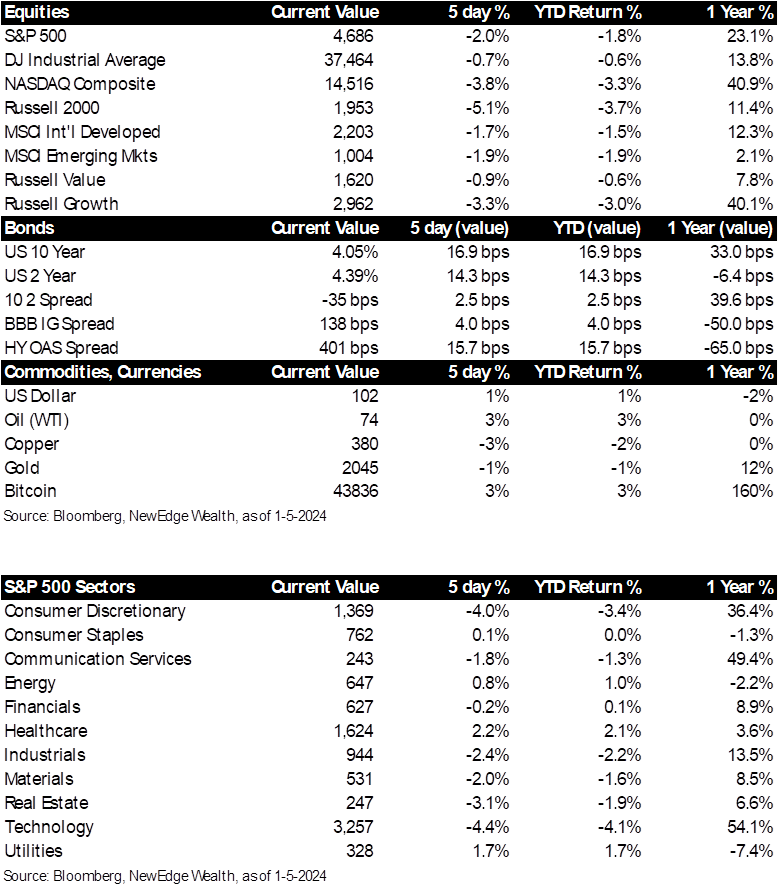
As we have started 2024, and after a roaring 4Q23 rally, all major U.S. equity indices have taken a breather, but Growth has fallen more than others (YTD S&P 500 -1.7%, Value -0.7%, Growth -2.8%).
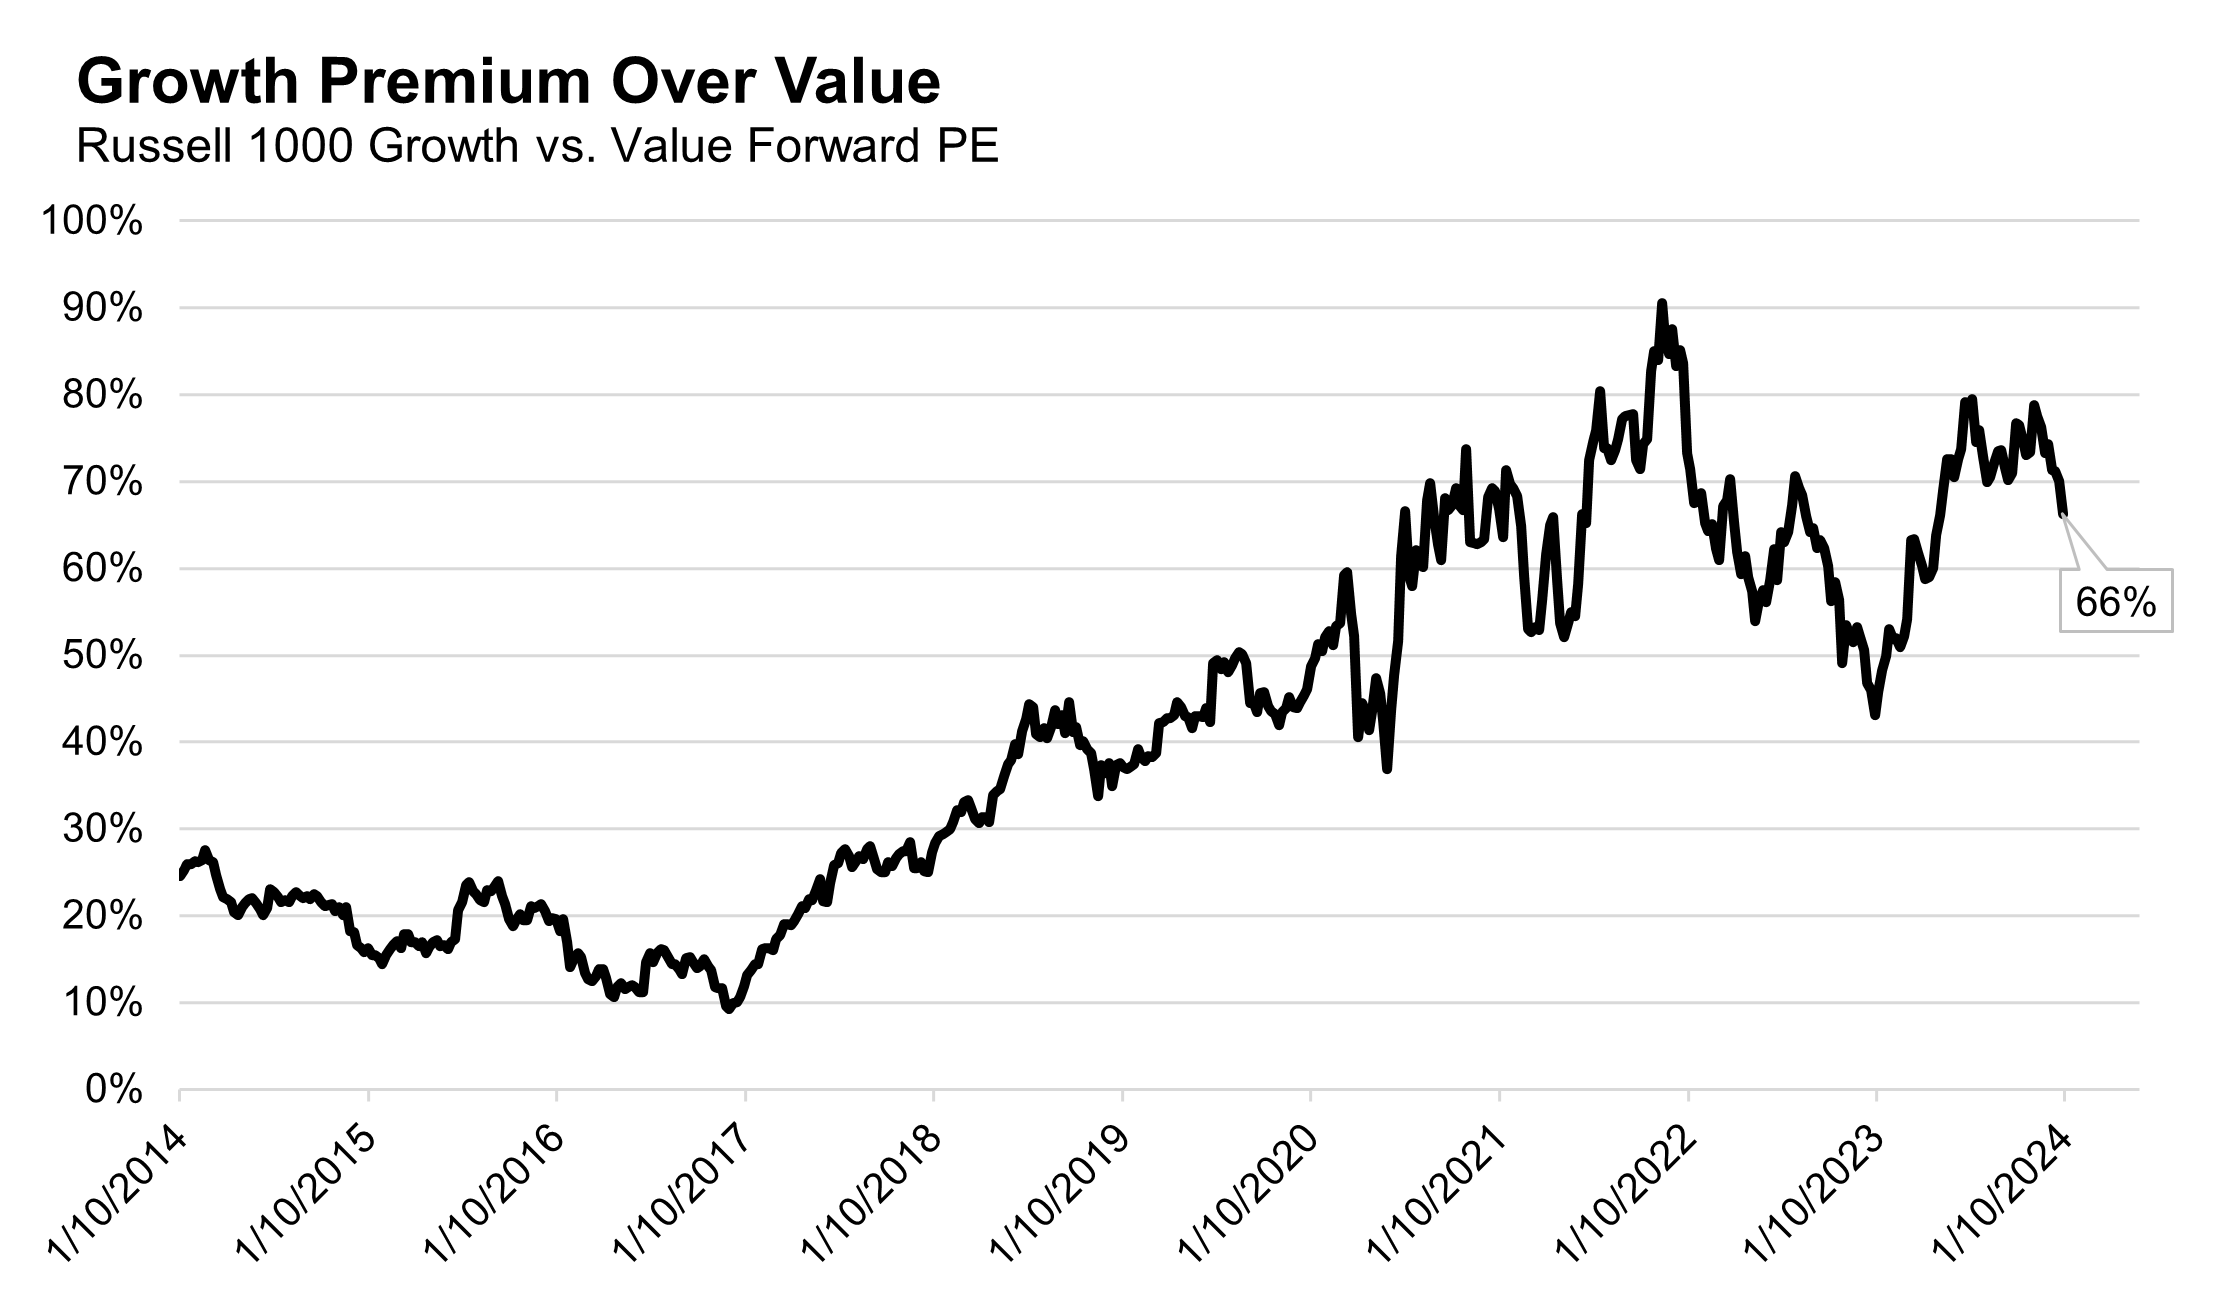
We are struck by the picture of Growth’s outperformance over Value shown in the chart below (this is a relative performance graph, meaning as the line goes up Growth is outperforming Value).
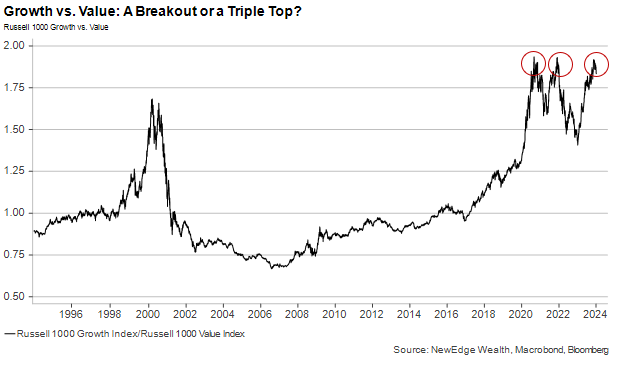
Here you can see how 2023’s Growth outperformance brought the Growth vs. Value ratio back up to the highs reached in September 2020 and December of 2021, both periods that were followed by Growth underperformance/Value outperformance.
Is this Growth vs. Value ratio shaping up to form a triple top, setting up for another period where Growth underperforms Value (like early 2021 and all of 2022)?
Or is anticipating a resurgence in Value “expecting just a little bit too much from the wounded”, setting up for a resumption of Growth outperformance?
Despite the picture above, it may be too early to proclaim the demise of Growth’s ability to outperform in 2024, as leadership rotations are common in the first weeks of trading each year, but are not always durable.
This means we should look for signs of durability in Value’s outperformance/Growth’s underperformance. This requires monitoring signs of trend change (in the index and underlying sectors/stocks), considering valuations/sentiment/positioning, and tracking earnings growth projections.
Our conclusion after going through all of these considerations (presented below) is that, just like one of Maynard’s “3 Libras”, we should be balanced in our approach to Growth vs. Value.
For Growth, we see the benefit of having exposure to sectors and companies with strong secular/idiosyncratic growth potential, noting that Growth’s expected earnings growth is stronger than Value’s over the coming years. On the other hand, we see the challenge for Growth having concentrated exposure to 2023’s Magnificent 7 leadership, a stretched valuation, and now crowded positioning in the Technology sector, a major weighting in the Growth index.
For Value, we see the benefit of less stretched valuations and signs of life in the relative performance of sectors that are large weights in the Value index, noting large positioning outflows from these sectors during 2023. On the other hand, we must monitor earnings growth trends closely, noting a recent trend of EPS revisions lower, along with the longer term reality that many Value sectors do not have as strong of secular growth tailwinds as Growth sectors.
Overall, we see the potential brewing for Value to continue to outperform Growth in the near term, however, this does not mean that investors should blindly buy Value and sell Growth, as we see near term investment opportunity and long-term attractiveness in both indices. We see the need for a high degree of selectivity within each index, underpinned by a quality focus and valuation discipline.
You Don’t See Me at All: Index Construction of Growth vs. Value and its Implications
To do any analysis of Growth vs. Value, investors must appreciate how different these two indices are in their concentrations and sector exposure.
On concentration, below you can see the top 10 names in the Value index are just 17% of the total, while the top 10 names in the Growth index are a whopping 51% of the total.
This top-heavy concentration has grown over the past year, just like with the S&P 500, given the huge outperformance of Magnificent 7 and other top 10 names. In fact, the table below shows how the top 10 names in the Growth index contributed over 100% of the index’s gains for 2023.
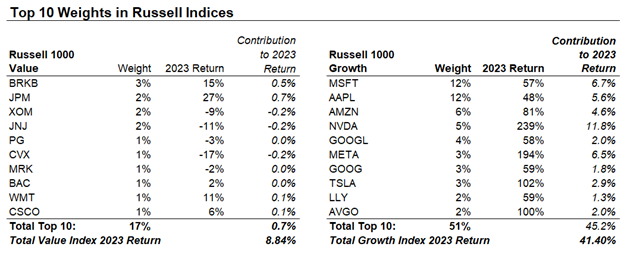
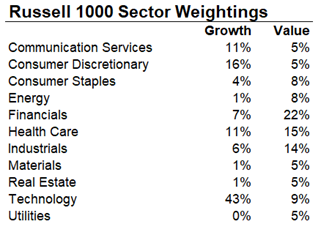
From a sector perspective, the Russell 1000 Growth and Value indices are notably different as well. Growth has 70% of its entire exposure in Technology, Consumer Discretionary, and Communication Services (where most of the Magnificent 7 are classified), compared to Value with 51% exposure to Financials, Health Care, and Industrials.
This leads to an important observation about positioning. In our prior Weekly Edge we noted how, according to Deutsche Bank data, Technology saw the largest inflows of any sector by a huge margin in 2023 (nearly $40B), while Financials, Health Care, and Energy all saw significant outflows in 2023 (over $15B each). This suggests that positioning is far more crowded in Growth’s highest concentration sectors, compared to Value, where positioning is light.
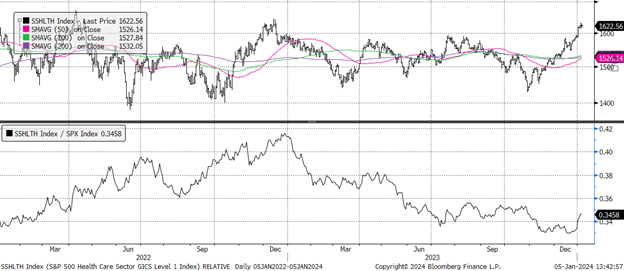
We have been seeing some early “signs of life” in the relative performance of beaten up, left behind Value sectors, like Health Care, which if it continues would be supportive of Value outperforming Growth.
S&P 500 Health Care Sector Absolute (Top) and Relative to the S&P 500 (Bottom)
Overall, we would classify Growth’s concentration and sector exposure, given stretched positioning, as a potential headwind for the Growth index’s performance in 2024.
Threw You the Obvious: Valuation of Growth and Value
On valuation, the message is clear: Growth is expensive versus its history and versus Value.
As shown in the charts below, after peaking at 77% at the end of 2023, Growth is now trading at a 66% premium to value. This is below the “blow off top” peak of 90% reached in late 2021 during the COVID policy bubble, but still well above the 10-year average of 41%. There is an argument that Growth should trade at a large premium to Value over time given the high quality nature of many growth stocks (strong cash generation, strong return on invested capital), so we think a reasonable floor for this Growth premium to Value in the near term could be ~50%.
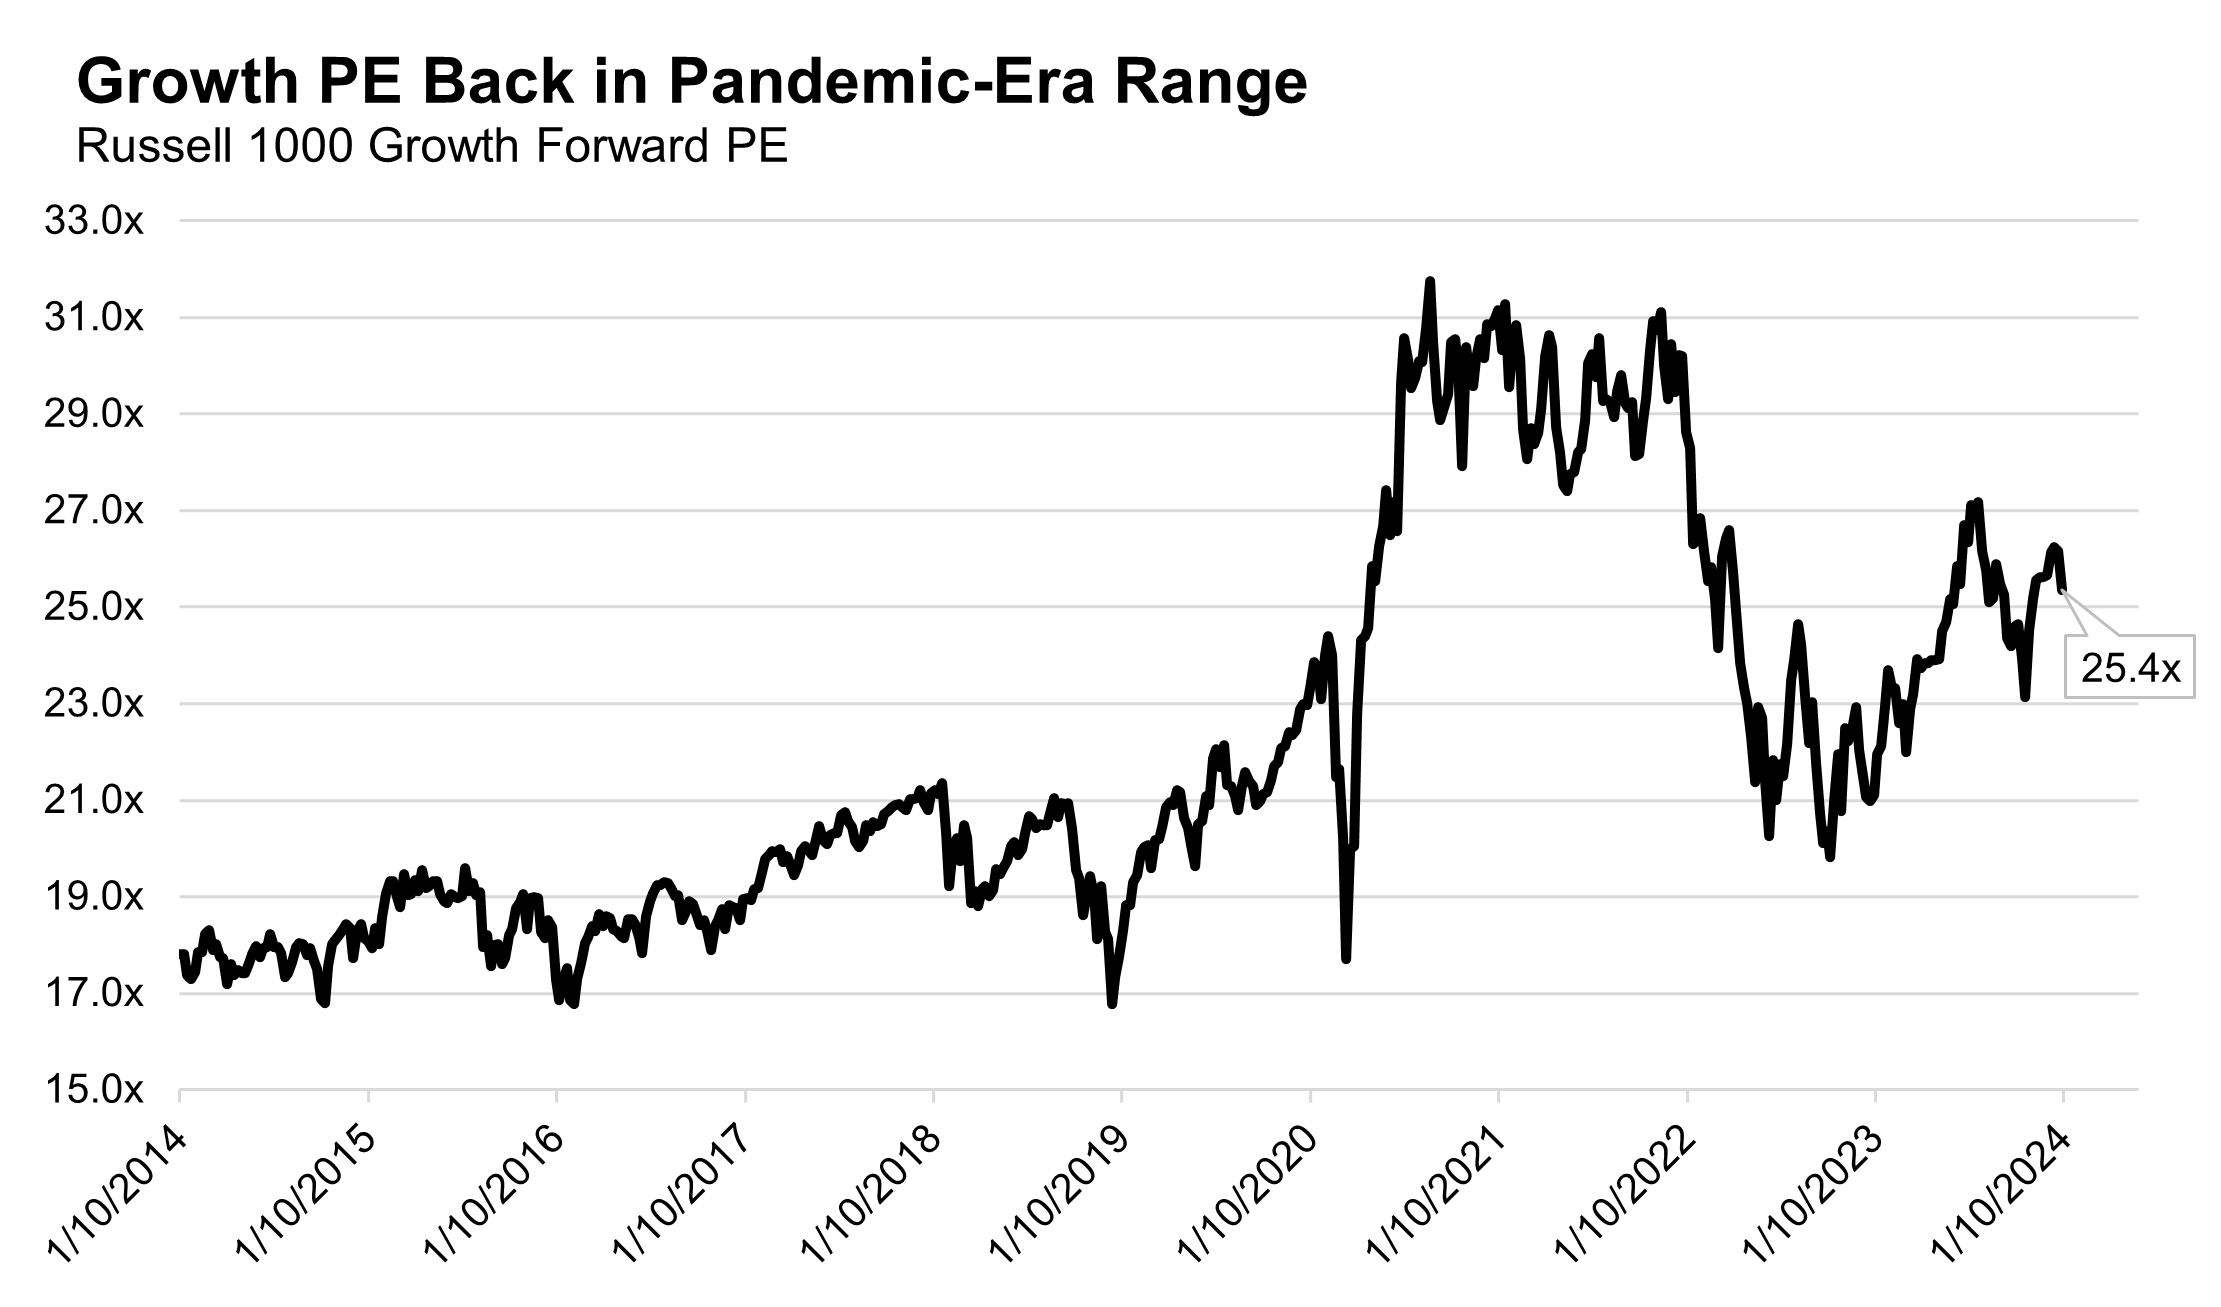
Growth’s absolute PE multiple at 25.4x is also rather full as well, after expanding +28% in 2023. It is down from the July 2023 high of 27x, but still well above the pre-COVID peak of 24x.
We are hesitant to assume, in a “normal” market environment, that Growth will return to its pandemic-era range of 27x+ given the notably different policy backdrop to today (even if the Fed does cut rates in 2024, it will not be nearly as aggressive as the unprecedented easy policy/stimulus of 2020/2021). As we wrote in a recent Weekly Edge, a risky return to a 1998 bubble environment is a slight possibility given easy the Fed’s move to ease policy, which in that case, all measures of “normal” valuation would be tossed out the window!
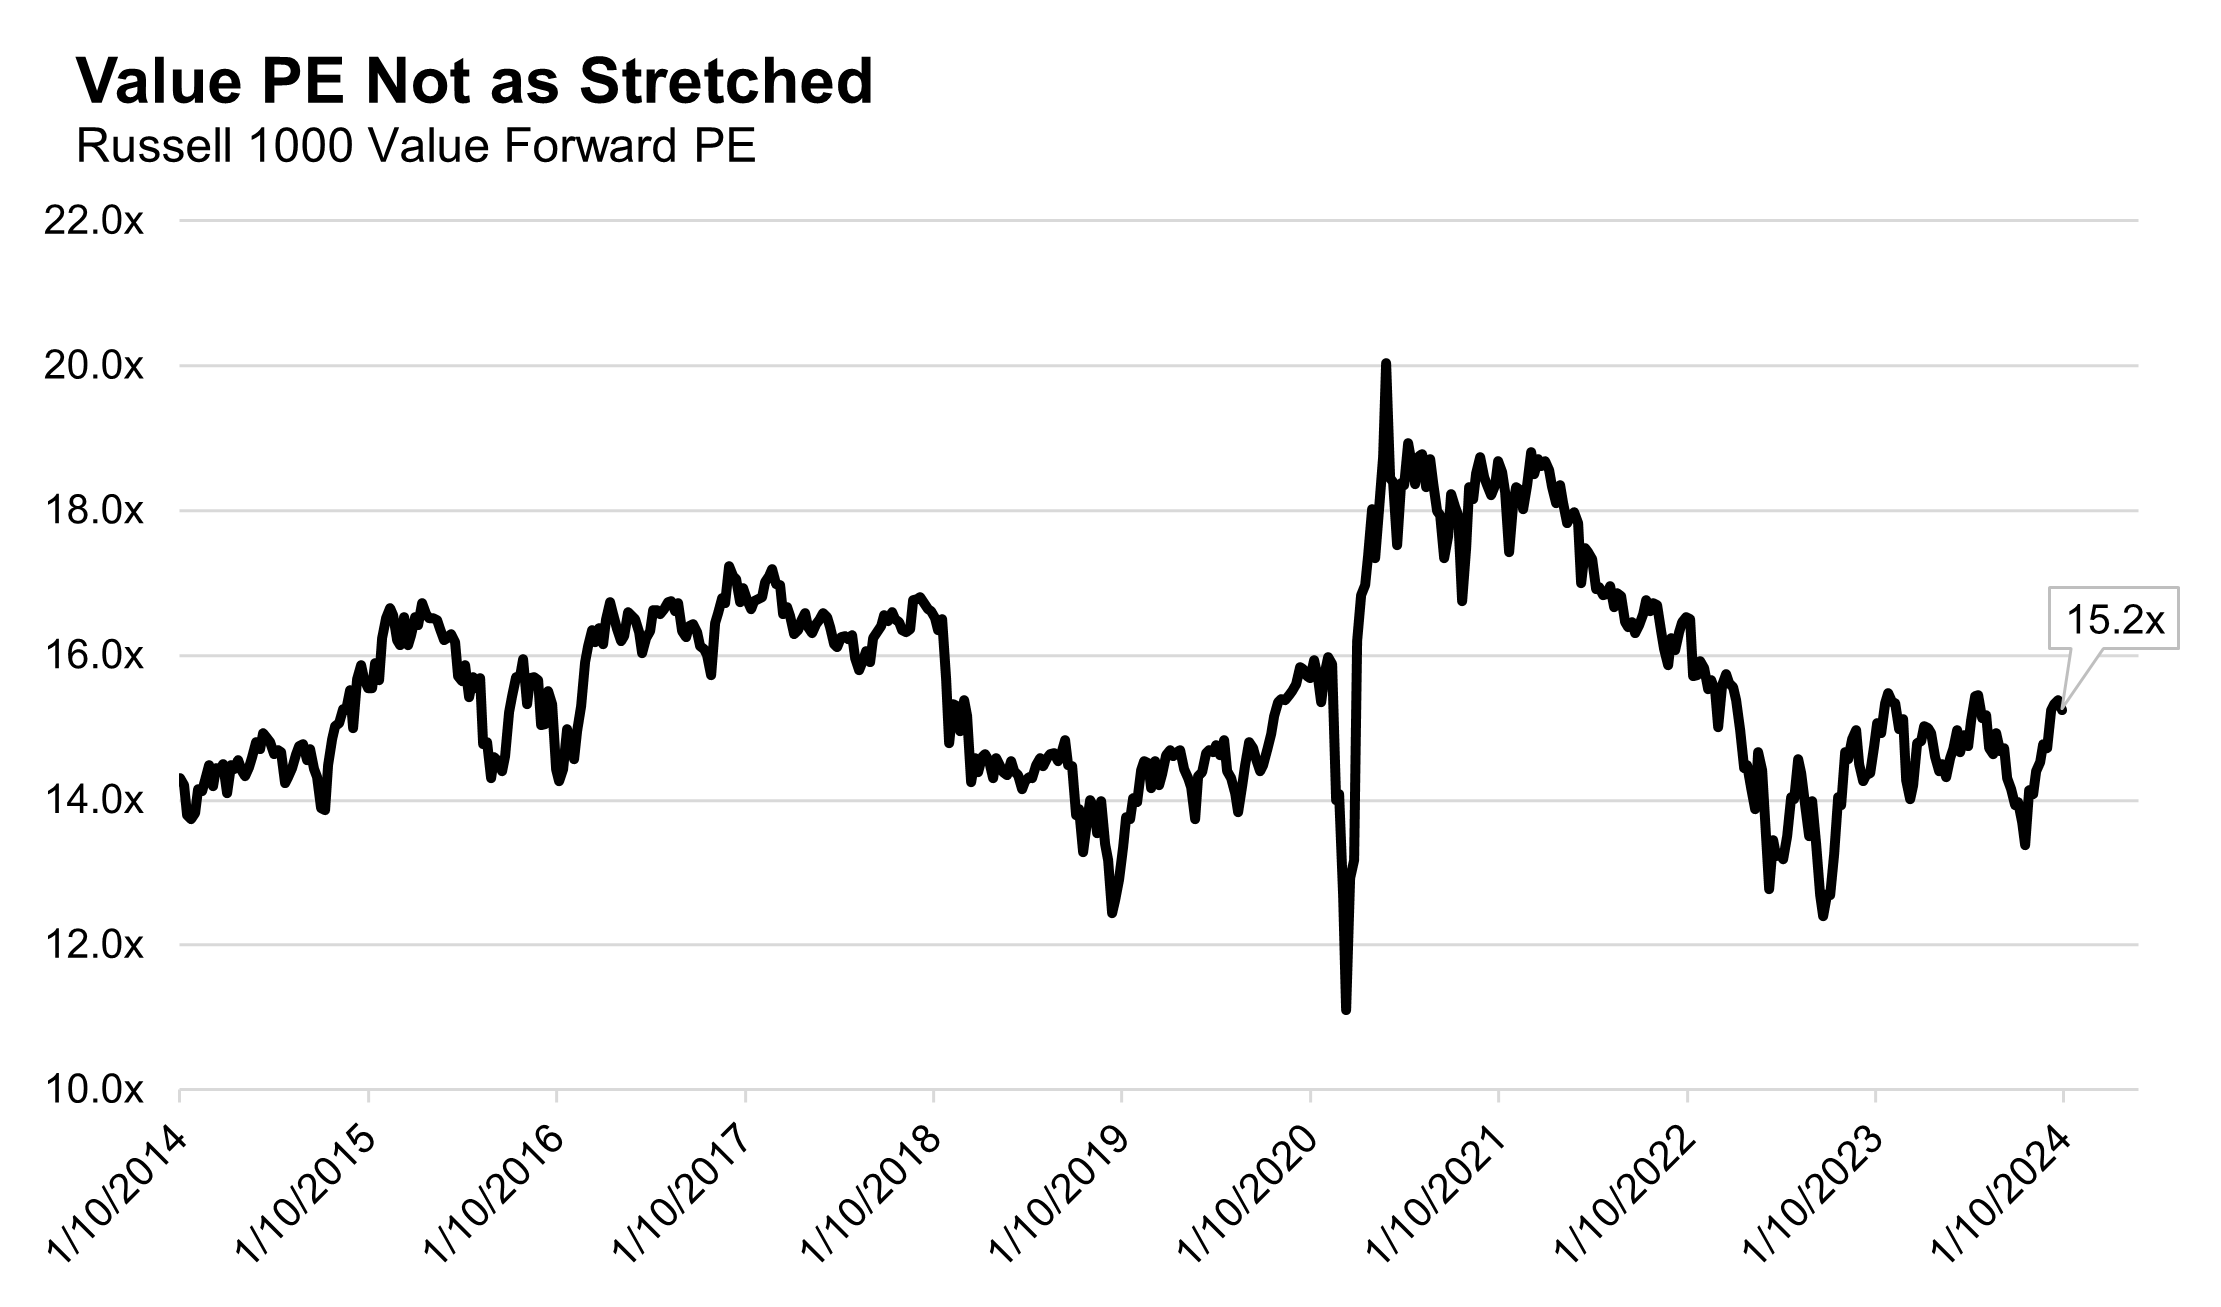
On Value’s absolute valuation, we can observe that at 15.2x forward, Value is not stretched after expanding just +8% in 2023. Though Value’s “cheap” valuation has rarely been a catalyst for immediate relative outperformance, arguably there is more room for valuation upside to the top of pre-pandemic ranges for the Value index versus the Growth index.
Just to See if There’s More Behind: Growth and Value Earnings Trends
Growth’s huge outperformance in 2023 was not just because of valuation expansion, as shown above, but Growth’s earnings growth and earnings revisions also outpaced Value.
Below you can see how Growth’s EPS growth outpaced Value in 2023 and is expected by Wall Street consensus to continue to do so in 2024 and 2025.
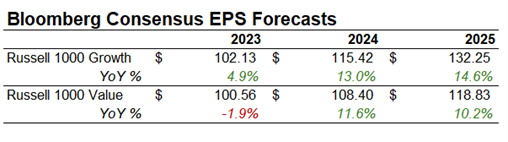
Further, over the course of 2023, earnings estimates for 2023-2025 were revised higher for Growth and lower for Value. This was an important driver of relative performance last year, as Growth’s EPS revisions higher helped to justify the soaring stock prices.
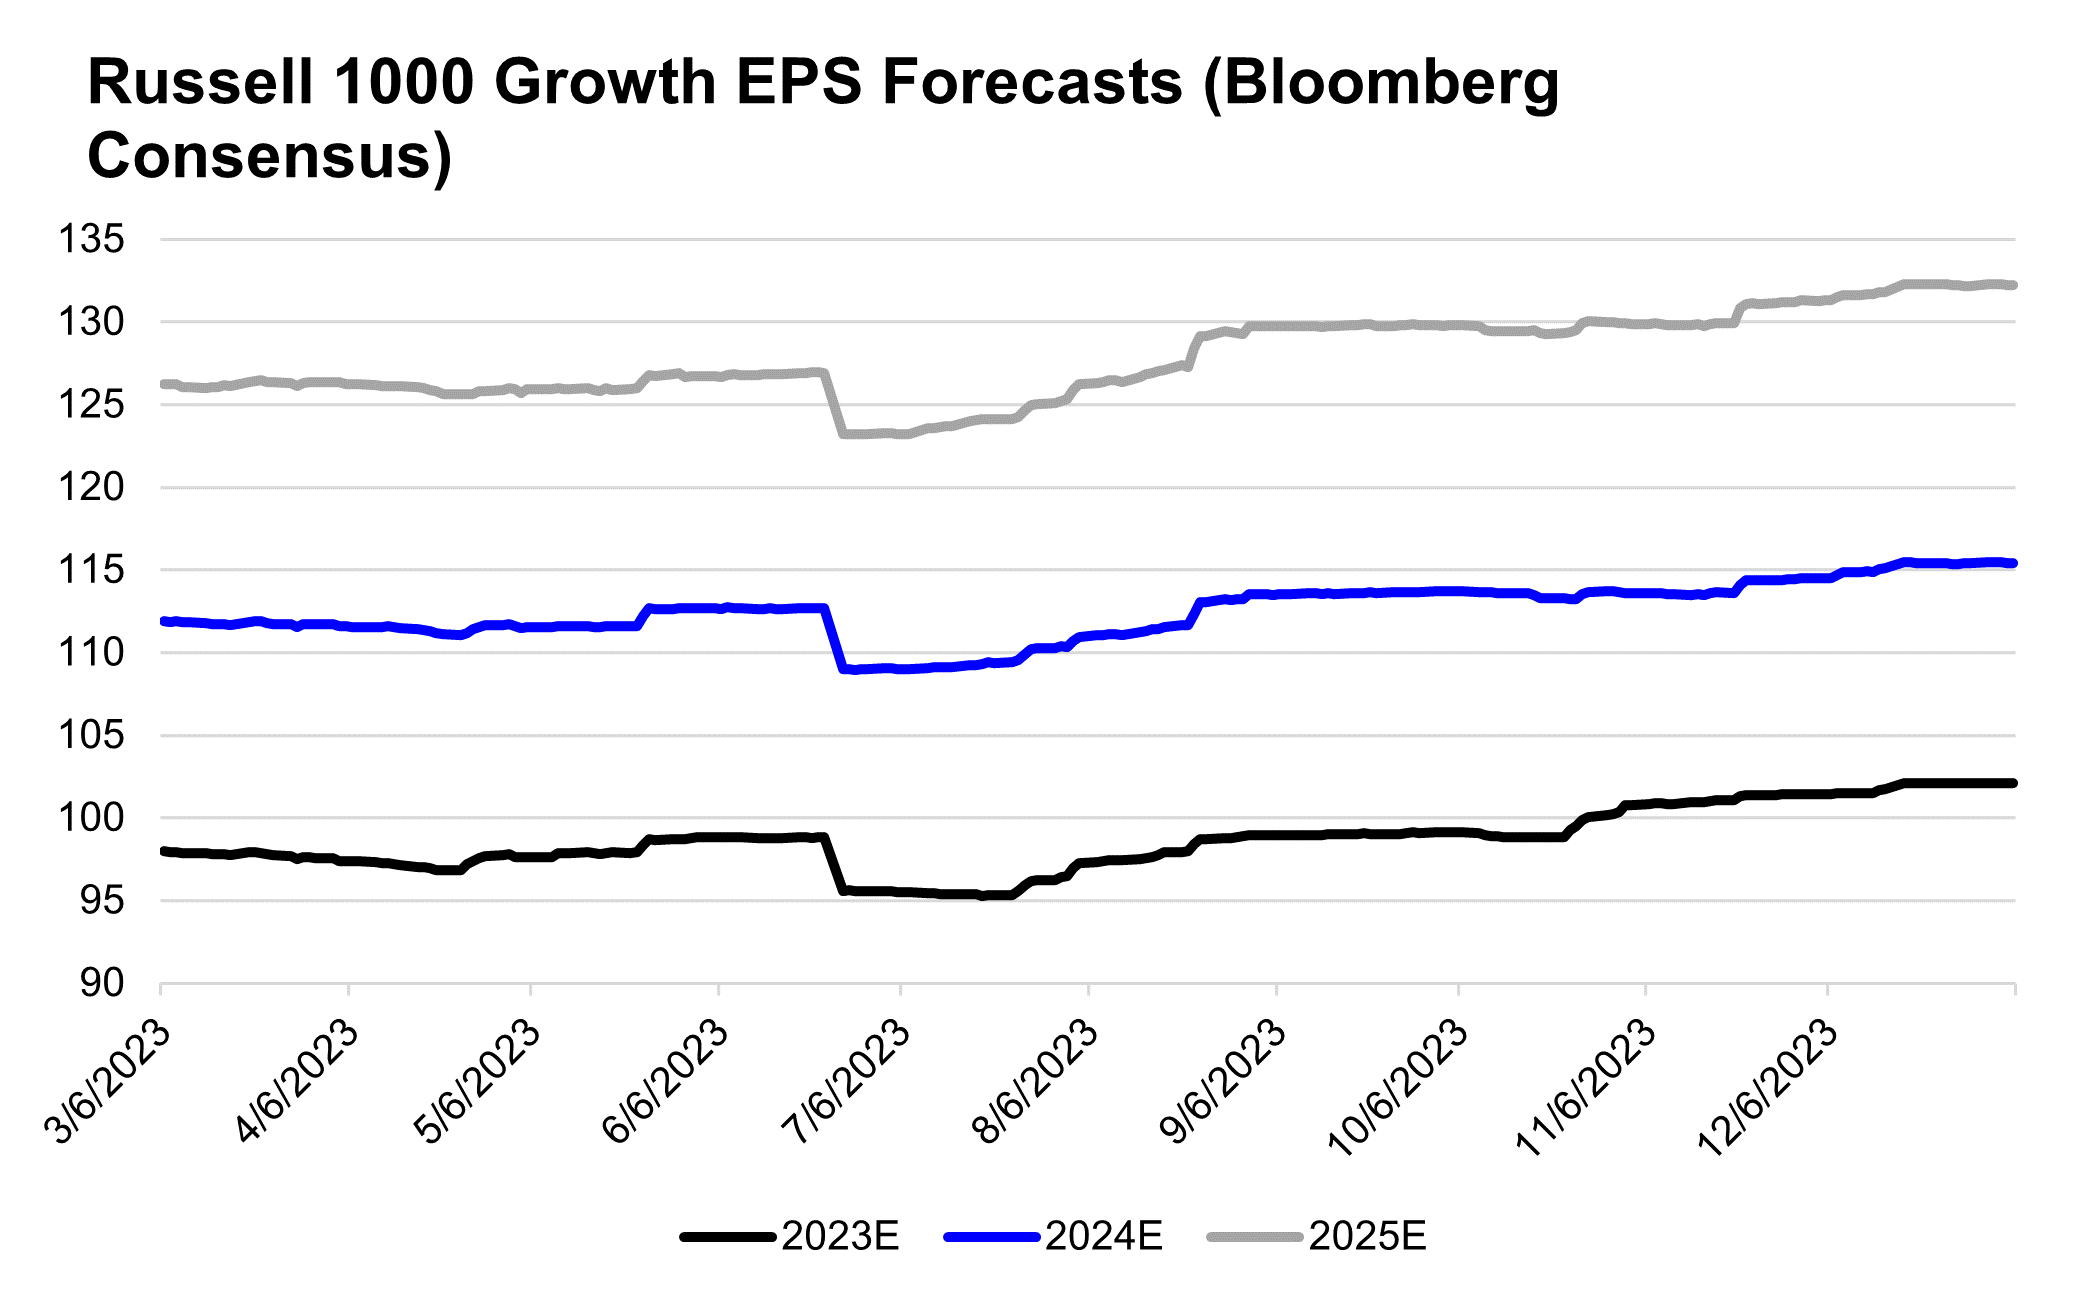
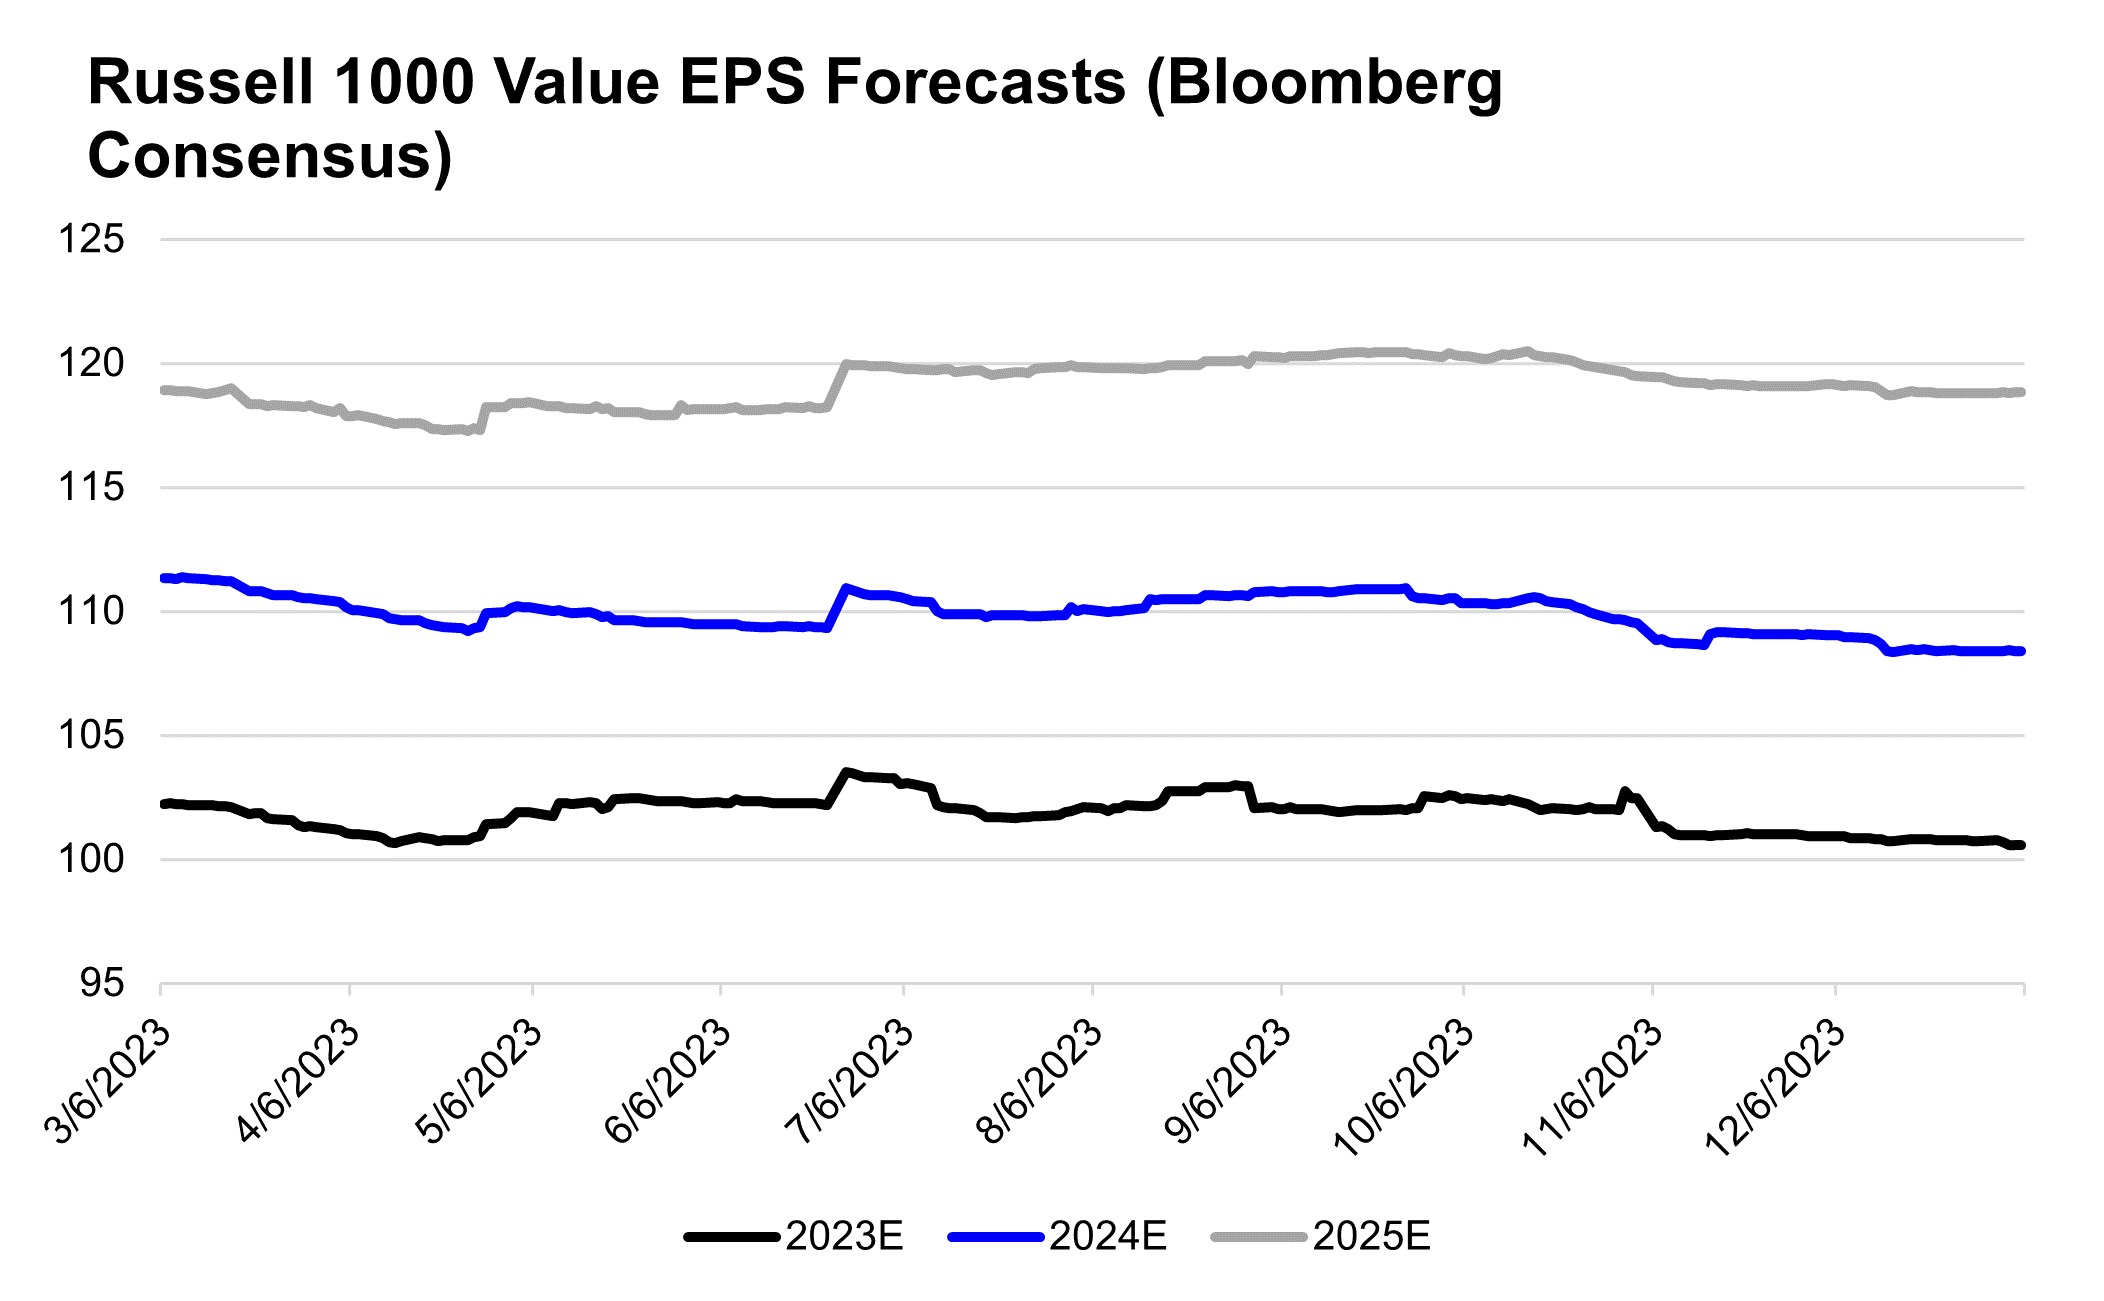
As we enter 2024, it will be important to monitor the trajectory of Value’s earnings revisions. If these revisions continue to be lower, Value could struggle to maintain its nascent run of outperformance. A better economy/soft landing could be helpful to Value, but it is notable that even as 2023 U.S. GDP was being revised higher throughout the year, Value EPS was being revised lower, highlighting that even cyclical earnings can become disconnected from underlying economic dynamics.
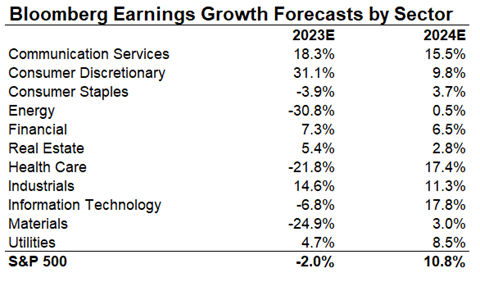
One last note on earnings revisions, the bulk of the downward revisions in 2023 for Value did come from Energy and Health Care, which are two sectors, as seen below, that are expected to return to positive EPS growth in 2024.
Conclusion
We are watching closely (or pulling out our Libra Scales of Justice) for indications that Value’s early outperformance in 2024 could be setting up for a triple top in Growth vs. Value, meaning a period where Growth underperforms Value. After just one week in 2024, it is early to make this call definitively, but we will continue to monitor index positioning, valuation, and earnings data to determine the durability of this leadership shift.
This supports investors who may be overweight Growth after its large run in 2024 to consider opportunities in Value, mostly considering the lower concentration of the Value index could provide greater opportunity for security/sector selection, with the added benefit of light positioning and reasonable valuations.
Even if Growth were to underperform in 2024, there are still likely to be opportunities within the Growth index, mostly for long-term investors, but investors should be attune to both concentration risk and valuation ceilings in the short run as outlined above.
Top Points of the Week
By Austin Capasso and Ben Lope
1. Equities in the Red – All around,equities seem to be in a period of digestion afterreaching double digit returns in the last two months. Major US indices and international indices, as well as smaller market capitalization indices, all finished the week in the red.
2. US 10-year Breaks Through 4%, Again – Treasuries sold off across the board after a stronger than expected December jobs report this morning, which gave traders reason to lower their expectations for a rate cut in March. The move was led by longer term maturities, where we saw the 10-year reach 4.10%, finishing this week just above the important technical level of 4%.
3. Oil Prices Remain Stable Despite Red Sea Conflicts – Despiteincreasing military engagement in the Red Sea region arising from Houthi attacks on and hijackings of commercial vessels, oil prices are little changed. The price of Brent crude oil is just under $80, slightly lower than the level it traded at when the Yemen-based rebel group initially made hijacking headlines, and almost 10% lower than its level on October 7, the date that Hamas terrorist attacks officially ignited the Israel-Hamas war. Analysts have credited the stability in oil prices to increased crude and refined product exports from the US to Europe, which has helped plug the gap left by decreased flows of these products from India and the Middle East.
4. ISM Services PMI Surprises to the Downside – The Institute for Supply Management’s (ISM) non-manufacturing PMI for December fell to its lowest level since May, registering a level of 50.6, well below economist expectations of 52.6. This PMI reading is just above 50, the level that demarcates expansion from contraction, and was 2.1 points lower than November’s reading. Treasury yields moved slightly lower on the news, as a slowdown in the service sector could portend future Fed rate cuts.
5. Gold Keeps Pushing Higher – Gold rose this week after the ISM Services PMI came in weaker than expected and Treasury yields pushed lower, which ultimately increased expectations for the Fed to cut rates more rapidly this year. The services PMI reading convinced investors that the jobs market will eventually weaken, which would drive gold prices higher. Gold was up nearly 13% in 2023 and hit a record high in early December 2023. It is anticipated to push higher still, due to the expected rate cuts by the Fed.
6. Hot December Jobs Report – The US economy added 216,000 jobs in the month of December, which was well above the 170,000 estimate. Most of the hiring this month stemmed from government jobs and healthcare, but we are starting to see momentum in other sectors. For all 2023, employers added 2.7 million jobs, a slowdown from the 4.8 million added in 2022 but still above the years preceding the pandemic. The unemployment rate dropped to 3.7% versus the 3.8% expected. Average hourly earnings rose 0.4% on a monthly basis and 4.1% on an annual basis, which were both higher than expectations. This resulted in markets lowering the odds of a March rate cut to about 55% and leaves a somewhat bumpy road for the Fed to reach their 2% target on inflation. Overall, it speaks to a continuation of the Fed’s “higher for longer” rate regime.
7. Fed Minutes Conclusions – Minutes from the Federal Reserve’s December FOMC meeting were released on Wednesday and indicated that members of the central bank expect to enact three quarter point rate cuts in 2024. Fed officials “viewed the policy rate as likely at or near its peak for this tightening cycle,” which likely fed into the revised Dot Plot revealing that meeting participants expect the US economy’s inflation rate to continue its decline back toward the Fed’s 2% long term goal over the next three years as further cuts are enacted.
8. The Week Ahead – The Consumer Price Index (CPI) release on Wednesday is the marquee economic event for the week ahead. This will be an important watch item to judge the path of inflation, especially after what seemed to be an active holiday season for the US consumer. If CPI comes in lower than expected, we will have to watch for any implications to the probability of projected Fed rate cuts to come. Next week also gives us insight into US consumer credit health, a reading on the Producer Price Index (PPI), and a look into the Treasury budget.
IMPORTANT DISCLOSURES
Abbreviations/Definitions: Brent blend: a blend of crude oil extracted from oilfields in the North Sea between the United Kingdom and Norway. It is an industry standard because it is “light,” meaning not overly dense, and “sweet,” meaning it’s low in sulfur content; CPI: Consumer Price Index; Dot Plot: The Fed dot plot is published quarterly as a chart showing where each of the 12 members of the FOMC expect the federal funds rate to be for each of the next three years and the long term; EPS: earnings per share; FOMC: Federal Open Market Committee; ISM Services PMI: The Institute of Supply Management (ISM) services PMI (formerly known as Non-Manufacturing Index) is an economic index based on surveys of more than 400 non-manufacturing (or services) firms’ purchasing and supply executives; PE: price to earnings ratio, the ratio of share price of a stock to its EPS.
Index Information: All returns represent total return for stated period. S&P 500 is a total return index that reflects both changes in the prices of stocks in the S&P 500 Index as well as the reinvestment of the dividend income from its underlying stocks. Dow Jones Industrial Average (DJ Industrial Average) is a price-weighted average of 30 actively traded blue-chip stocks trading New York Stock Exchange and Nasdaq. The NASDAQ Composite Index measures all NASDAQ domestic and international based common type stocks listed on the Nasdaq Stock Market. Russell 2000 is an index that measures the performance of the small-cap segment of the U.S. equity universe. MSCI International Developed measures equity market performance of large, developed markets not including the U.S. MSCI Emerging Markets (MSCI Emerging Mkts) measures equity market performance of emerging markets. Russell 1000 Growth Index measures the performance of the large- cap growth segment of the US equity universe. It includes those Russell 1000 companies with relatively higher price-to-book ratios, higher I/B/E/S forecast medium term (2 year) growth and higher sales per share historical growth (5 years). The Russell 1000 Value Index measures the performance of the large cap value segment of the US equity universe. It includes those Russell 1000 companies with relatively lower price-to-book ratios, lower I/B/E/S forecast medium term (2 year) growth and lower sales per share historical growth (5 years). The BBB IG Spread is the Bloomberg Baa Corporate Index that measures the spread of BBB/Baa U.S. corporate bond yields over Treasuries. The HY OAS is the High Yield Option Adjusted Spread index measuring the spread of high yield bonds over Treasuries.
Sector Returns: Sectors are based on the GICS methodology. Returns are cumulative total return for stated period, including reinvestment of dividends.
The views and opinions included in these materials belong to their author and do not necessarily reflect the views and opinions of NewEdge Capital Group, LLC.
This information is general in nature and has been prepared solely for informational and educational purposes and does not constitute an offer or a recommendation to buy or sell any particular security or to adopt any specific investment strategy.
NewEdge and its affiliates do not render advice on legal, tax and/or tax accounting matters. You should consult your personal tax and/or legal advisor to learn about any potential tax or other implications that may result from acting on a particular recommendation.
The trademarks and service marks contained herein are the property of their respective owners. Unless otherwise specifically indicated, all information with respect to any third party not affiliated with NewEdge has been provided by, and is the sole responsibility of, such third party and has not been independently verified by NewEdge, its affiliates or any other independent third party. No representation is given with respect to its accuracy or completeness, and such information and opinions may change without notice.
Investing involves risk, including possible loss of principal. Past performance is no guarantee of future results.
Any forward-looking statements or forecasts are based on assumptions and actual results are expected to vary from any such statements or forecasts. No assurance can be given that investment objectives or target returns will be achieved. Future returns may be higher or lower than the estimates presented herein.
An investment cannot be made directly in an index. Indices are unmanaged and have no fees or expenses. You can obtain information about many indices online at a variety of sources including: https://www.sec.gov/answers/indices.htm.
All data is subject to change without notice.
© 2026 NewEdge Capital Group, LLC
