


Am I more than you bargained for yet?
“Sugar, We’re Goin Down”, Fall Out Boy
2000’s emo and pop-punk is having quite a resurgence, with the return of Warped Tour, a plethora of 20th -plus anniversary tours celebrating great album releases, and even a wave of new music inspired by those intrepid, skinny-jean-wearing, swoop-haired rockers (we are particular fans of new entrant Like Roses).
But it’s not just 2000’s rock music that is capturing nostalgic imaginations today, it is also mid-2000’s yields.
One of the most popular assertions amongst fixed income strategists and investors today is that the recent jump in yields is not a concern because it is merely a return to “normal” levels that were experienced in the 2000’s, prior to the Great Financial Crisis (GFC).
We think this simple “normalization” argument completely misses an important point, one that is best expressed by amending the title of one of the greatest songs of the 2000’s emo/pop-punk era to: “Sugar, We’re (No Longer) Goin Down”.
“Break a Name”: The Bond Bull Market That No Longer Is
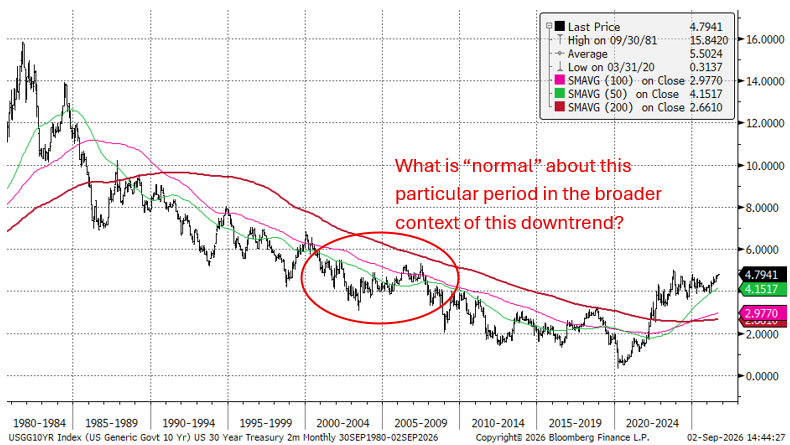
When considering this “return to normal” argument for bond yields, we acknowledge that bond yields are back to levels that we haven’t seen since the 2000’s, but we cannot call those 2000’s level yields “normal” given 2000’s level yields were well below the yields of the 1990’s and certainly well below the yields of the 1980’s.
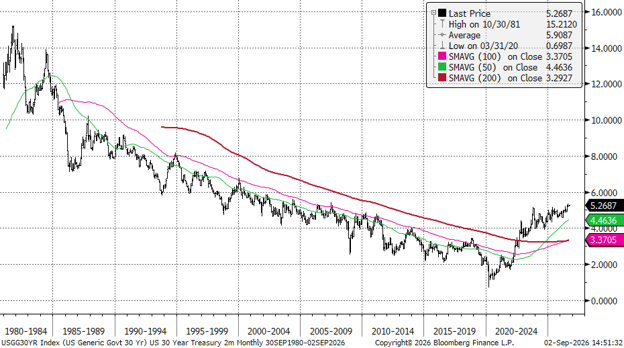
The best way to appreciate this lack of normal is to gaze upon the long-term charts for 10 and 30 year Treasury yields. As you can see from the charts shown below, each decade (or arguably half decade) over the last 45 years experienced a different average level and range of yields, with each successive period delivering lower yields than the prior period…until now.
This, of course, is another way of saying that we had a 40 year bull market in bonds, or a 40 year downtrend in yields (remember bond prices rise as yields fall). But now, that 40 year trend is over.
10 Year Treasury Yield
Source: Bloomberg, NewEdge Wealth, as of 9-2-26
30 Year Treasury Yield
Source: Bloomberg, NewEdge Wealth, as of 9-2-26
So instead of comparing today’s yields to an arbitrary half decade in the 2000’s (though we agree it was a great era of music!), we think the more important comparison is that the trend in yields for the past 5 years is very different than the trend that persisted for the 40 years. Sugar, We’re (No Longer) Goin’ Down…
For 40 years, yields were in a consistent downtrend, with the 10 Year Treasury falling from an apex of 15% in 1981 to a nadir of 0.5% in 2020.
Of course, that ultimate 2020 low in yields in the initial aftermath of COVID and its extraordinary policy response was historically unprecedented (the lowest yields in history!) and certainly not “normal”, but it was not just the level of the 2020 low that was historic, it was that it marked the bottom and the end of the 40 year bond bull market.
Since that time, yields have been on the rise. The end of the 40 year bull market in bonds was made “official” with the breakout of the prior downtrend back in 2022, with yields continuing their ascent in the years that have followed (though of course not in a straight line).
So, yes, yields are higher from the distinctly, abnormally low range in the 2010’s, but we think the more important comparison is that recently we have experienced an uptrend in yields versus the downtrend in yields that persisted from 1981-2020.
“Is This More Than You Bargained for Yet?”: The Impact of Yields in an Uptrend
Why does the change in the yield trend matter?
The 40-year bull market in bonds meant that for 40 years, borrowers largely enjoyed a falling cost of capital. Back in 2023, when the obituaries of the bond bull were being written, we highlighted how, using 7-year rolling windows (to imitate the average maturity of investment grade corporate bonds at the time) from 1981-2020, yields were lower at the end of the 7 years than the beginning 90% of the time. This meant that each successive refinancing came with a lower cost of capital.
This falling cost of capital allowed for many mega trends including the proliferation of financial engineering-enabled investment strategies, a general rise in public and private market valuations, a persistent expansion of corporate profitably, a shrinking reliance on short-term debt as long yields continued to fall, and an era of “minimal consequence” for governments to increase public debt.
Each of these mega trends is worthy of its own ink and pages, but suffice it to say, we are starting to see the consequences of the downtrend in yields shifting to an uptrend.
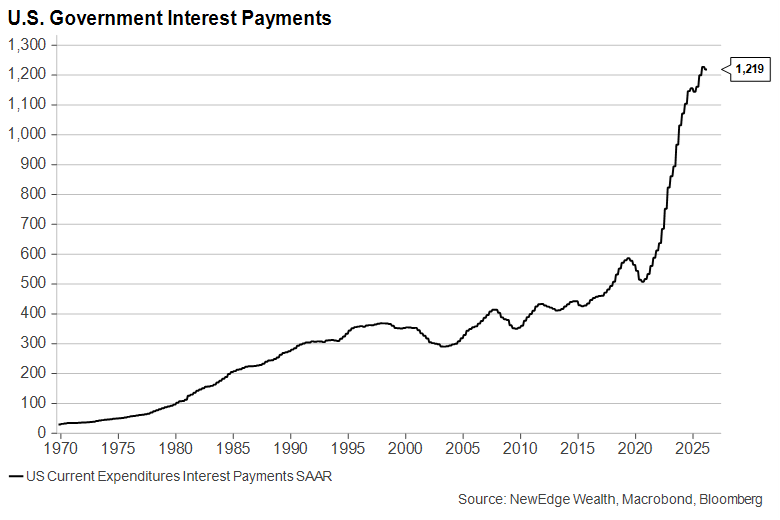
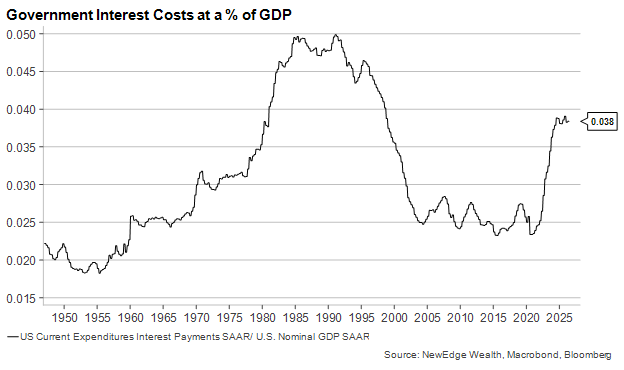
For example, we are beginning to see the shift of the cost of servicing public debt from having minimal consequence when rates were low, to meaningful consequence as rates are higher and rising.
The charts below show how the cost to service public debt in the U.S. has exploded higher (to an annualized $1.2 trillion!), with interest expense as a percentage of GDP rising to levels not seen since the 1990’s.
We will not spend these pages discussing potential implications of or solves for this rising debt servicing cost (it’s a holiday weekend after all!), but we simply make the point that debt and deficit decisions carry far more consequence in a rising rate environment versus the falling rate environment during the bond bull market.
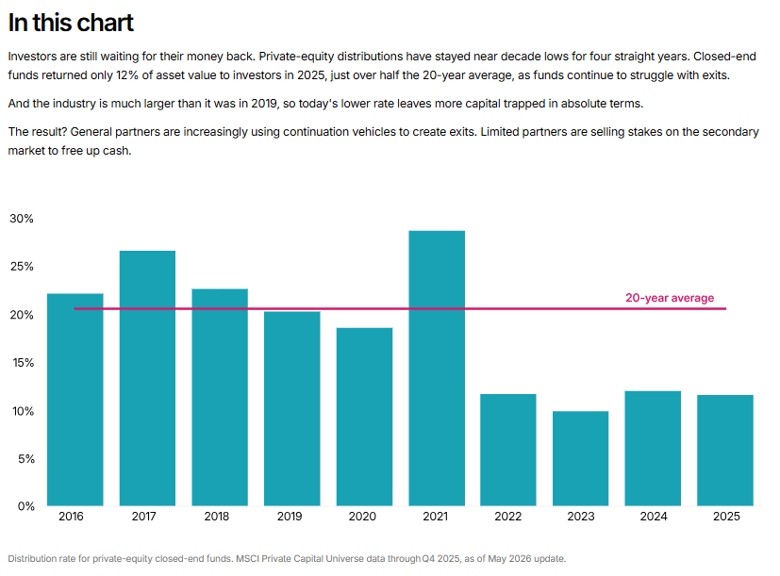
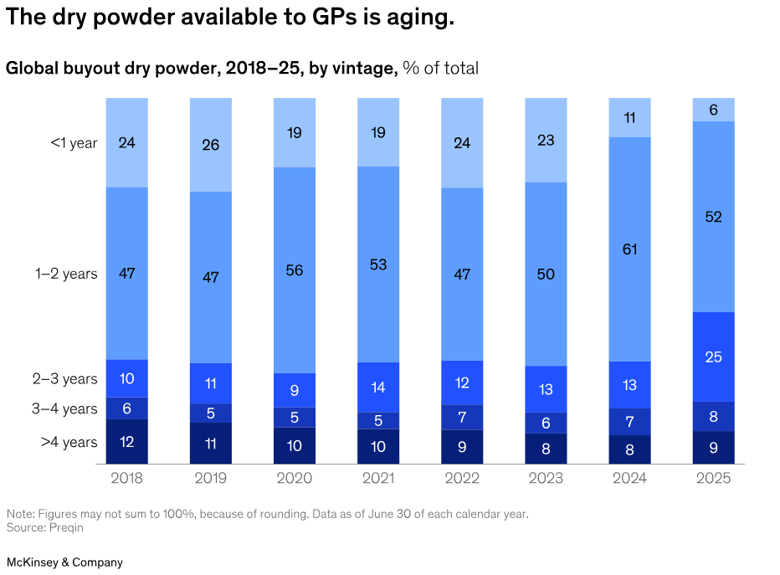
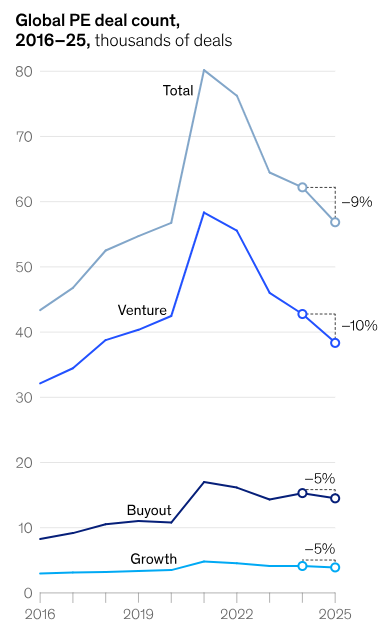
For another example, investment strategies made possible by financial-engineering have been struggling in the post-COVID era of climbing yields. Consider leveraged, large cap private equity. There has been a “distribution drought” for the past four years within private equity, as funds struggle to find buyers for highly valued and highly leveraged legacy investments, despite record levels of “dry powder” at funds needing to be invested.
The three charts below illustrate this paradox of assets needing to be sold, cash needing to be deployed, but few deals getting done. It is also this paradox as to why we have been and continue to argue that this disruption drought creates opportunity for thoughtful private equity investors to be highly selective and focus on smaller, less leveraged, and specialty strategies.
There are, of course, plenty of other areas that have been impacted acutely by both the level and trend in yields in recent years (housing, non-tech non-residential construction, autos, and smaller, floating rate borrowers, etc.), but there has been one, important area of the economy that has yet to broadly feel this uptrend in rates.
“Oh, Don’t Mind Me”: Corporate Net Interest Expense
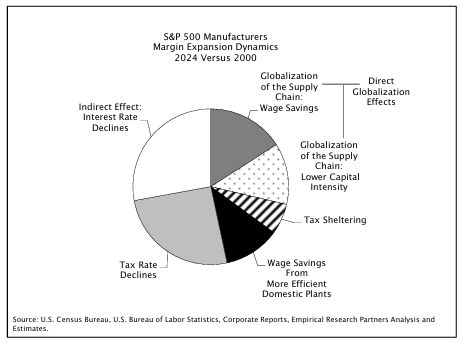
The 40 year bull market in bonds meant that for 40 years interest expense fell as a percentage of corporate profits, providing a boost to net income margins and profits. In fact, Empirical Research Partners estimates that over a quarter of the expansion in margins for manufacturers in the S&P 500 from 2000-2024 came from falling interest rates.
The chart below shows this constant march lower in interest expense as a percentage of corporate profits, but one thing should jump out: unlike every other time the Fed raised rates (blue line going up), when the Fed raised rates beginning in 2022, interest expense as a percentage of profits did not raise, in fact it continued to fall!
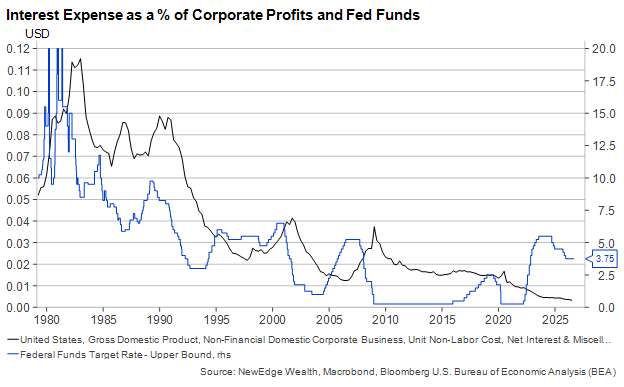
As of September 2026
It was for this reason, going all the way back to 2023, that we believed the economy would be more resilient than consensus expected and not experience a much-feared recession.
At the time, we saw large corporate (and household) balance sheets as more immunized to short-term rate increases, and even net beneficiaries of higher rates. This somewhat heretical take was informed by the observation that the constant march lower of long-term interest rates to their ultimate low in 2020 allowed borrowers to “term out” borrowing and not rely on short term funding as much in the past. This meant that as the Fed raised rates starting in 2022, interest expense, which many had locked in at low long-term yields, barely increased while massive post-COVID cash balances began to pay out huge sums of interest income.
The net result is the chart below: for the first time, as the Fed raised rates in 2022, net interest expense (interest expense minus interest income) fell in the aggregate corporate data.
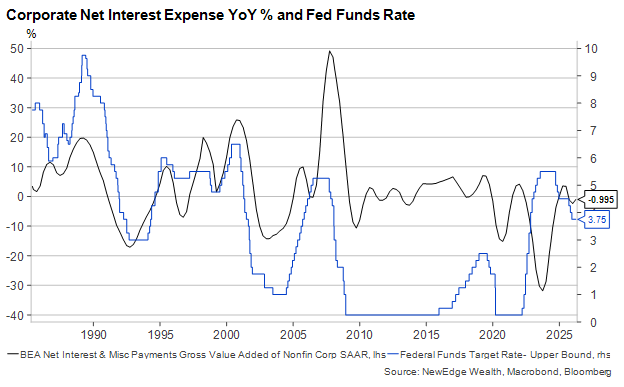
As of March 2026
We expect to see these aggregate borrowing costs begin to creep higher, as debt from the 2010s and early 2020s needs to be refinanced at now higher rates, and corporates go on a record borrowing spree to fund surging capex needs.
“I’ve been dying to tell you anything you wanna hear”: Conclusion
We have argued in this piece that we should not view the move higher in yields as a return to “normal” levels, but instead further evidence of a departure from the “normal” downtrend that persisted from 1981-2020 to what is now an uptrend in yields. We outlined how this uptrend in yields has disrupted certain parts of the market and economy, but not others, yet.
This, of course, raises the question as to whether this uptrend will continue and if we will see new cycle highs for 10 and 30 year bond yields. This, of course, would have significant implications on bond investors, broad markets, and the economy, so it is a topic we will unpack in the coming weeks.
Until then, enjoy your last glimpses of summer and have a safe Labor Day!
IMPORTANT DISCLOSURES
The views and opinions included in these materials belong to their author and do not necessarily reflect the views and opinions of NewEdge Capital Group, LLC.
This information is general in nature and has been prepared solely for informational and educational purposes and does not constitute an offer or a recommendation to buy or sell any particular security or to adopt any specific investment strategy.
NewEdge and its affiliates do not render advice on legal, tax and/or tax accounting matters. You should consult your personal tax and/or legal advisor to learn about any potential tax or other implications that may result from acting on a particular recommendation.
The trademarks and service marks contained herein are the property of their respective owners. Unless otherwise specifically indicated, all information with respect to any third party not affiliated with NewEdge has been provided by, and is the sole responsibility of, such third party and has not been independently verified by NewEdge, its affiliates or any other independent third party. No representation is given with respect to its accuracy or completeness, and such information and opinions may change without notice.
Investing involves risk, including possible loss of principal. Past performance is no guarantee of future results.
Any forward-looking statements or forecasts are based on assumptions and actual results are expected to vary from any such statements or forecasts. No assurance can be given that investment objectives or target returns will be achieved. Future returns may be higher or lower than the estimates presented herein.
An investment cannot be made directly in an index. Indices are unmanaged and have no fees or expenses. You can obtain information about many indices online at a variety of sources including: https://www.sec.gov/answers/indices.htm.
All data is subject to change without notice.
© 2026 NewEdge Capital Group, LLC

