


Just how deep do you believe?
“The Hand That Feeds”, Nine Inch Nails
Equity markets are biting the hand that feeds.
It is no secret that the largest contributor to S&P 500 returns in 2026 has been the AI infrastructure trade (AI capex recipients), with key names MU, AMD, INTC, SNDK, and AMAT accounting for 55% of the S&P 500’s return YTD and posting an average gain of 356% YTD! This huge rally in AI infrastructure is made possible by a massive increase in capex from hyperscalers, the large cloud computing companies that are building the physical infrastructure of AI (GOOGL, META, AMZN, MSFT, and ORCL). It is these hyperscalers’ willingness to fund huge AI infrastructure capex by spending nearly or completely all of their operating cash flow, tapping debt markets, and raising equity. After all, the reason why MU is able to print 85% gross margins and 830% earnings growth in 2026 is that hyperscalers are willing to reach deep into their pockets in order to fund this massive amount of capex (see here for our overview of AI capex spenders and recipients)!
But instead of the market rewarding this aggressive spend, seeing these hyperscalers as building and owning the essential infrastructure of “the future,” the market has been punishing these hyperscalers in 2026, essentially biting the hand that feeds the AI infrastructure trade.
The basket of hyperscaler names (GOOGL, META, AMZN, MSFT, and ORCL) is down -9.5% YTD, trailing the S&P 500 by nearly 15%. These 5 names represent a 16% weight in the S&P 500, meaning their weakness is weighing on index returns in an outsized way (which is one reason why the Equal Weight S&P 500 is +10.5% YTD vs. the S&P 500’s +7.5%).
Hyperscaler Index Absolute and Relative to S&P 500
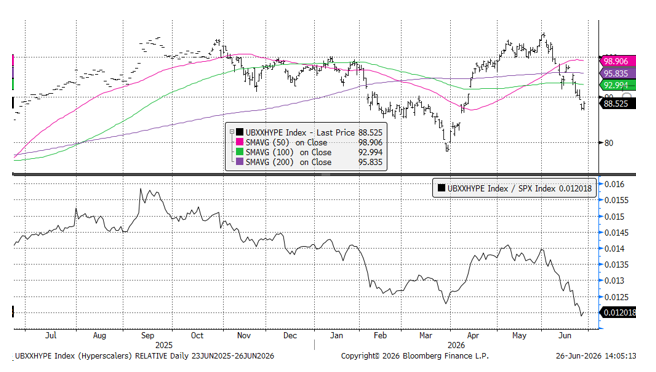
Source: Bloomberg, NewEdge Wealth, 6-26-26
But it is more than just the impact of this hyperscaler weakness on the index that we need to note. Importantly, we must assess how this share price weakness could impact the hyperscaler’s future plans to spend aggressively on AI capex, and thus how hyperscaler equity weakness could challenge the dominant AI infrastructure trade (semiconductors, tech hardware, electrical equipment, etc.).
Of course, we could see hyperscalers continue to spend, regardless of their near-term stock price performance, citing an existential arms race and pointing to an expected future inflection in the earnings payback of this AI capex. Or, we could see the market’s mood sour towards this aggressive spending so much that it ultimately puts pressure on management teams to find capex discipline, which likely has negative implications for the AI infrastructure trade.
And so, we find ourselves asking a similar question that Trent Reznor asks NIN listeners in “The Hand That Feeds”: “Just how deep do you believe” in the ability of hyperscalers to continue to aggressively grow AI capex spending? This may be the most important question with which this market will have to wrestle through the rest of the year.
“Got Your Chin Held High and You Do Just Fine”: Capex Guidance
In today’s market, just uttering that hyperscalers could pull back on or moderate spending during this apparent existential arms race seems sacrilege (which is a great Yeah Yeah Yeahs song, by the way), but importantly, we don’t have to see these hyperscalers actually cut capex to see the pace of returns in the AI infrastructure trade slow, we could just see 2027 capex growth slow versus expectations.
The key reason why 2026 has been such a powerful year for AI infrastructure returns is that analysts significantly underestimated how much the hyperscalers would be willing to spend their own and other people’s (debt and equity) money on data centers and, thus, underestimated how much demand would be flowing to these newly supply-constrained AI infrastructure players. Importantly, analysts significantly underestimating the magnitude of this AI infrastructure buildout has been a key feature of markets over the last 3.5 years.
As you can see in the Goldman chart below, analysts expected 36% growth for hyperscaler capex at the start of 2026 (this growth was expected to be a mere 10% this time last year!), but hyperscaler capex growth is now expected to be nearly 90% for 2026. As we turn our eyes to 2027, Goldman estimates that consensus expects another 22% growth to reach $920B, but we have seen estimates as high as $1.2-1.5 trillion for 2027 capex.
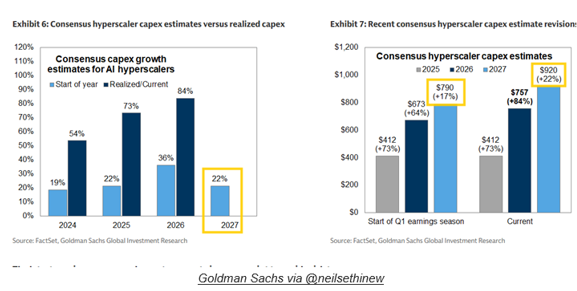
As of 6-12-26
“And Behind it All There’s a Price to Be Paid”: Can Markets Bridge the Gap to 2027?
This raises the question about how the hyperscalers will fund another large increase in capex in 2027.
Equity and debt markets have recently been receptive to incremental capital raises, but from the strongest players. GOOGL, for example, was able to issue a 100-year bond with robust demand back in February and raised a record $85B in equity in early June with the express purpose of “significantly increasing” 2027 capex. This is because GOOGL’s operating cash flow growth and balance sheet (it still has negative net debt thanks to a large cash balance) remain robust.
But other potential raises have not been as well received: META shares suffered after news broke that its management team was considering an equity raise similar to GOOGL, ORCL’s credit default swaps are back on the rise (noting their thin trading), neo-cloud player CRWV sank after its company looked to raise $3.5B in a dilutive equity round, and SPCX (a new entrant to the hyperscaler/neo-cloud game given the leasing of its data centers to Anthropic and Google) has seen its bond prices sink after the company raised $25B in debt markets. And so, this is a good reminder of Trent’s “just how deep do you believe?” question and that it doesn’t just apply to the hyperscalers’ belief that they need to spend more on AI capex, but it also applies to markets’ belief that this capex spend is an attractive use of significant capital.
“Do You Wanna Change It?”: Hyperscaler/Mag 7 Metrics
This brings us back to how the market has been judging the hyperscaler capex binge in 2026.
The chart below shows how the weakness in Mag 7 shares in 2026 has had nothing to do with earnings being weak; it has all been driven by valuation multiple compression. Note, we are using the Bloomberg Mag 7 index because it overlaps with the Hyperscaler index but has more history/data. Importantly, the Mag 7 is flattered by the exclusion of ORCL (which has the weakest free cash flow) and the inclusion of AAPL and NVDA (which has not spent aggressively on capex and is a capex beneficiary, respectively).
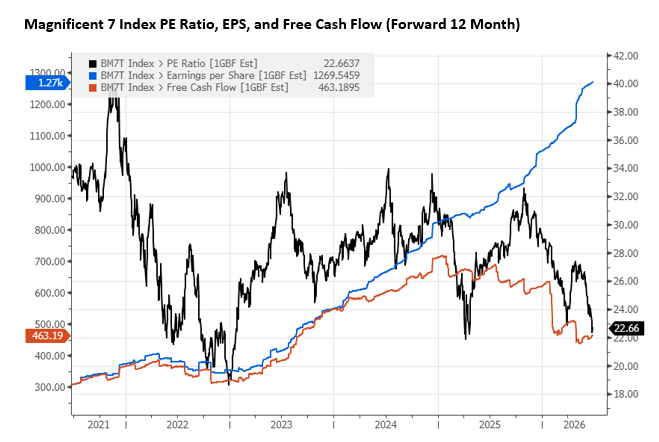
Source: Bloomberg, NewEdge Wealth 6-26-26
Note that the valuation of the Mag 7 has fallen by 10 multiple turns to 22x forward, at Liberation Day lows. For a bullish view, you could argue that this de-rating has been overdone and that the Mag 7 is poised for a rebound as valuations normalize. For a bearish view, you could argue that the market is now discounting a lower cash generative, lower ROIC, heavier debt-laden set of companies than in the past. Both may likely be true, as some of the hyperscaler stocks look “oversold” in the near term, but the transfiguration of these business models to be more capital-intensive is suggestive of a lower long-term valuation.
We bring it back to the starting question: how much share price, or valuation multiple, weakness will hyperscaler companies tolerate before they begin to rethink massive 2027 capex plans?
“What if This Whole Crusade’s a Charade?”: Conclusion
Trent Reznor asks a lot of questions in “The Hand That Feeds”, but this last one that titles the conclusion is the most trenchant (or could we say Trentchant??) for AI investors. What IF this whole crusade’s a charade?
We are not suggesting that AI is not exciting and revolutionary and still in the early days of a broad adoption that could have significant impacts on the market and economy, but instead noting that there are real debates as to how sustainable the current breakneck pace of AI infrastructure spending is, given questions about the profitability of AI model providers (those most using the infrastructure).
The flame of this debate grew hotter on Thursday when news broke that OpenAI may be delaying its IPO until 2027. This is important because OpenAI is MSFT’s largest cloud customer and represents 45% of MSFT’s cloud backlog.
The bullish argument in this debate is in reports like the recent “State of the AI Economy” from Exponential View that shows how direct AI revenue is growing rapidly (they estimate 3x faster than prior technology adoption cycles) and now starting to clear the “depreciation hurdle” of AI infrastructure investments that have already been made.
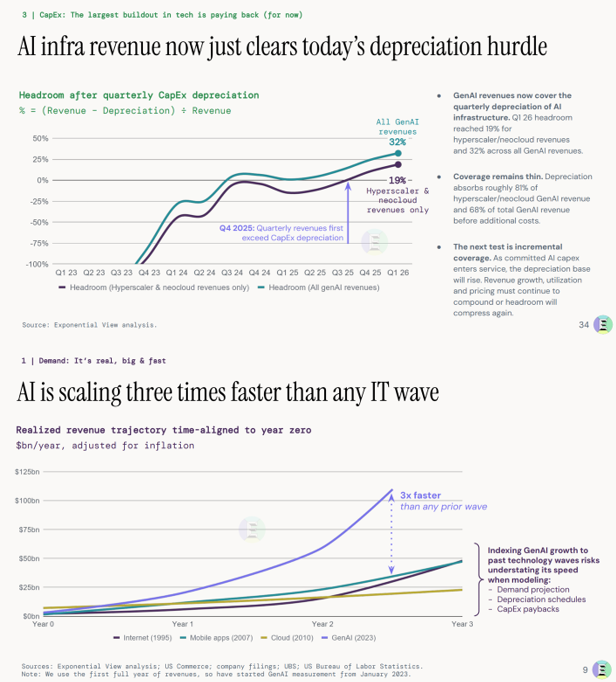
Source: Exponential View, June 2026
The bearish argument is in takes like Ed Zitron’s analysis of AI model developer unprofitability, flagging how losses could swell as revenues grow because of the high marginal cost of these business models that need ever-more compute to meet demand.
This raises a last, important point about competition amongst AI players and how some models may not be as capable as the US’s “top of the line”, frontier models, but because of their lower cost (and despite their foreign provenance) some simpler AI users are opting for these more cost-optimized models. Michael Cembalest’s latest Eye on the Market displays this well in the chart below.
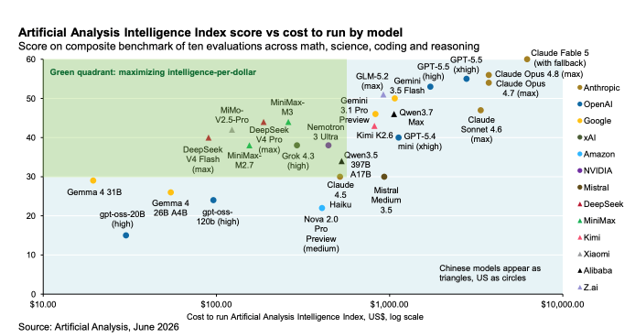
Source: JPM Eye on the Market, June 2026
This debate is clearly not settled, but after such a powerful and dominant run in the AI infrastructure trade, contrasted with weakness in the hyperscalers funding the boom in infrastructure earnings, we should not be surprised to see ample volatility.
IMPORTANT DISCLOSURES
The views and opinions included in these materials belong to their author and do not necessarily reflect the views and opinions of NewEdge Capital Group, LLC.
This information is general in nature and has been prepared solely for informational and educational purposes and does not constitute an offer or a recommendation to buy or sell any particular security or to adopt any specific investment strategy.
NewEdge and its affiliates do not render advice on legal, tax and/or tax accounting matters. You should consult your personal tax and/or legal advisor to learn about any potential tax or other implications that may result from acting on a particular recommendation.
The trademarks and service marks contained herein are the property of their respective owners. Unless otherwise specifically indicated, all information with respect to any third party not affiliated with NewEdge has been provided by, and is the sole responsibility of, such third party and has not been independently verified by NewEdge, its affiliates or any other independent third party. No representation is given with respect to its accuracy or completeness, and such information and opinions may change without notice.
Investing involves risk, including possible loss of principal. Past performance is no guarantee of future results.
Any forward-looking statements or forecasts are based on assumptions and actual results are expected to vary from any such statements or forecasts. No assurance can be given that investment objectives or target returns will be achieved. Future returns may be higher or lower than the estimates presented herein.
An investment cannot be made directly in an index. Indices are unmanaged and have no fees or expenses. You can obtain information about many indices online at a variety of sources including: https://www.sec.gov/answers/indices.htm.
All data is subject to change without notice.
© 2026 NewEdge Capital Group, LLC
