


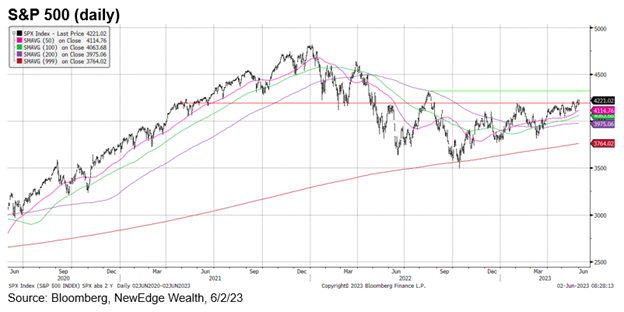
1. I Want to Break Free: After multiple attempts in May, the S&P 500 finally broke above the 4,200 level of resistance (the February 2023 high). The next higher level to watch is 4,300, the August 2022 high, which would result in the S&P 500 trading at 19.5x 2023 EPS ($220 consensus) and 17.7x 2024 EPS ($243 consensus). On a blended next twelve-month basis, the S&P 500 is currently trading at 18.6x, at the pre-pandemic peaks reached in early 2018 and early 2020.
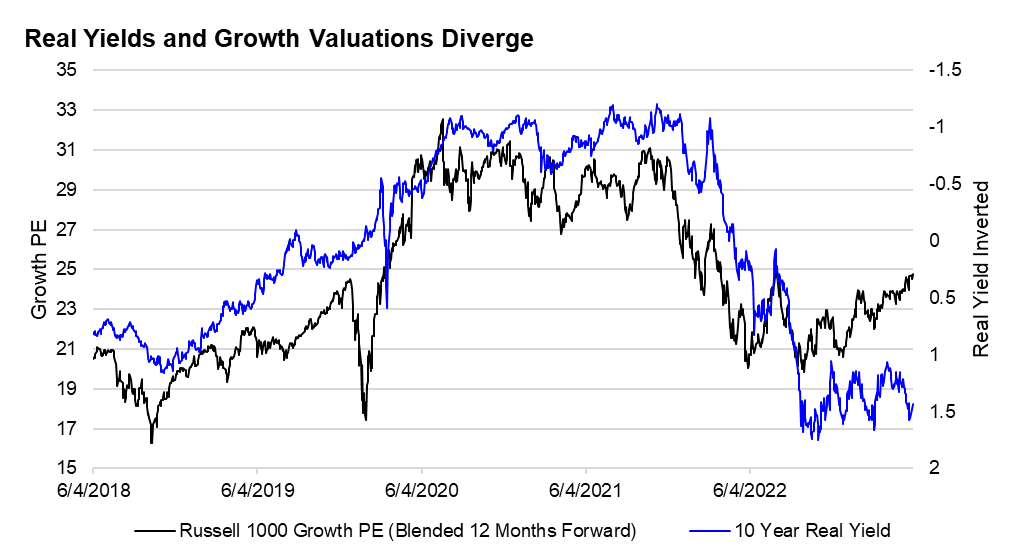
2. Go Your Own Way: Typically, higher real yields (yields adjusted for inflation) have put downward pressure on Growth/tech valuations, but not in 2023. There has been a marked divergence between real yields, which are back near 2023 highs of ~1.6%, and Growth valuations, which at 25x are now above their pre-pandemic peak. This surge to pandemic-era, ultra loose policy-fueled territory, could be explained by a flight to safety (investors hiding out in names with idiosyncratic growth drivers) and optimism/euphoria about artificial intelligence (AI), with its potential to propel future earnings growth.
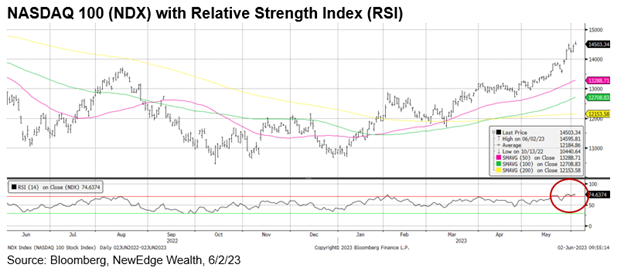
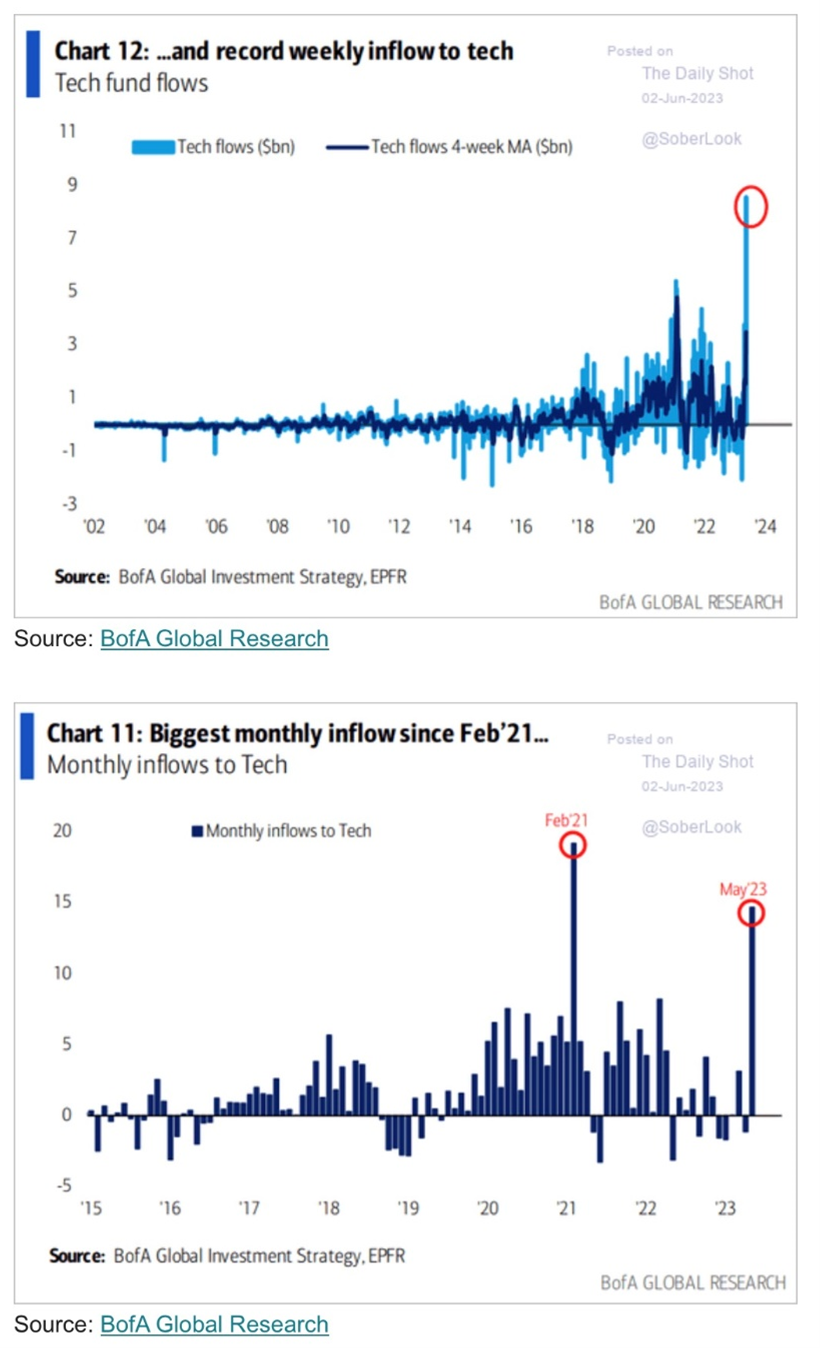
3. The Burden of Being Wonderful: After a large and rapid move higher in Tech/Growth/AI/Semi-Conductor stocks YTD, these stocks are now technically “overbought” (one way to measure this is with relative strength index, RSI, readings above 70). Further, according to Bank of America and EPFR data, investors are chasing the recent rallies in these stocks with huge inflows: weekly inflows into Tech reached a record last week (going back to 2002). This data could suggest a near-term stalling in, or digestion of, the recent bull-runs, but does not necessarily indicate that these bullish-trends are about to end.
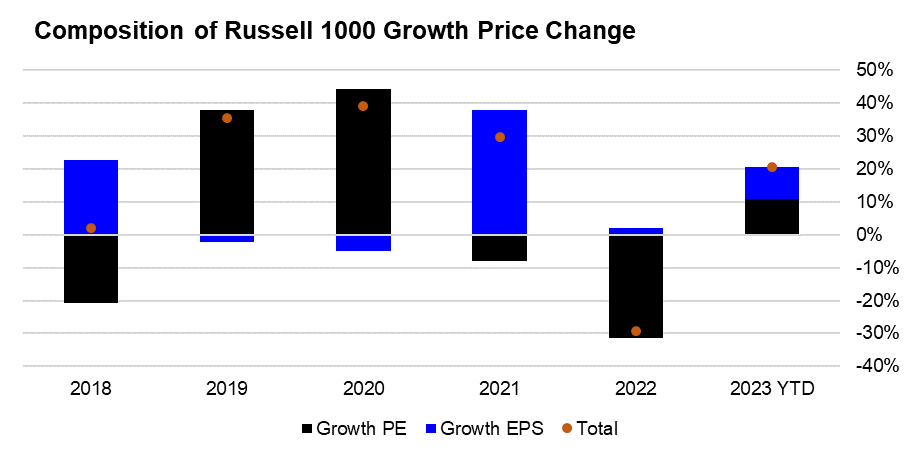
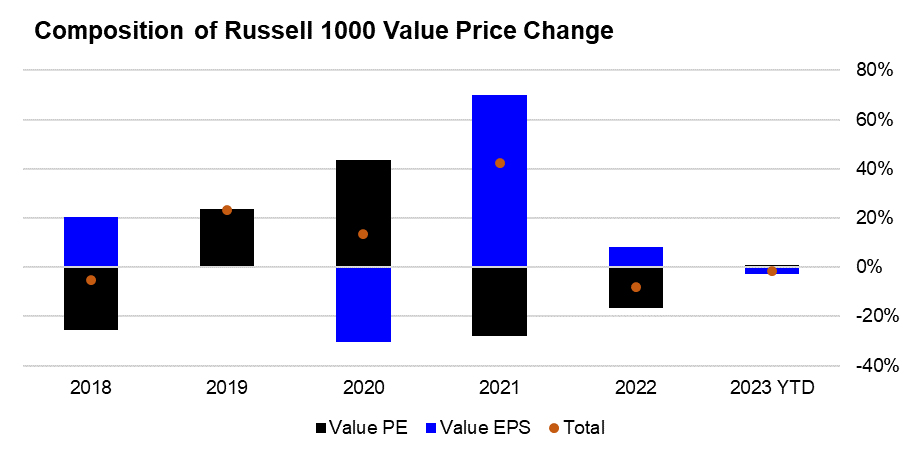
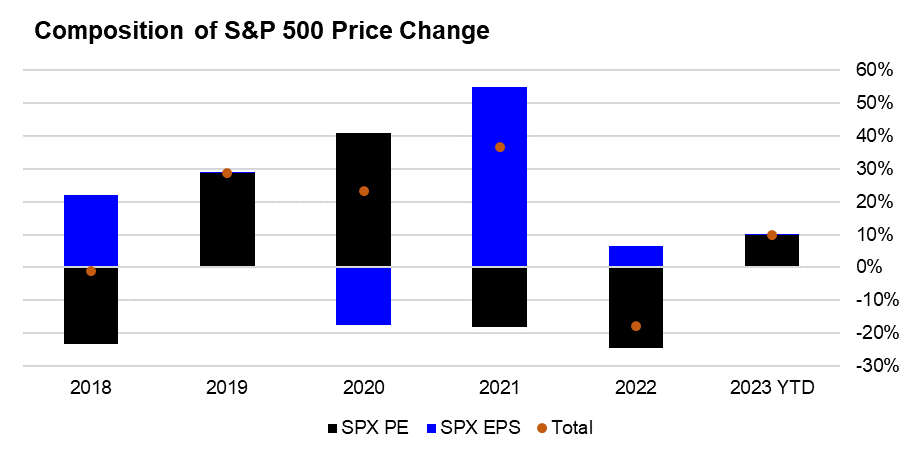
4. The Way We Get By: When we break down the stock price moves YTD into the change in earnings and valuations, we make a few interesting observations. First, the jump in Growth stocks is not just about valuations, there has also been a rise in Growth earnings, driven by a rebound to growth in Technology and Communications stocks after a muted 2022. For Value, there has been a slight decline in earnings, but also no boost from higher valuations. For the S&P 500, earnings have declined slightly, with 100% of the YTD return driven by valuation expansion, a surprise occurrence given the Fed’s continued tightening of policy. We think the biggest upside potential for the S&P 500 from here is an upside surprise to earnings growth.
5. It Costs a Lot of Money to Look This Cheap: Though the S&P 500 currently trades at an above average PE multiple today, under the surface there is a great deal of dispersion within the U.S. equity market. On the expensive side at Tech and Growth stocks, including the NASDAQ, which is trading at a notably stretched valuation. On the cheaper, below-average valuation side are Value stocks and the Equal Weight S&P 500 (which removes the outsized impact of high-flying mega-cap names). The important lesson of valuation is that it is a poor timing tool in the near term (valuations can get cheap and stay cheap) but have better predictive power for returns 1-3 years out. 2022’s sharp derating in high valuation stocks was a harsh lesson that high valuation can be a risk in and of itself.
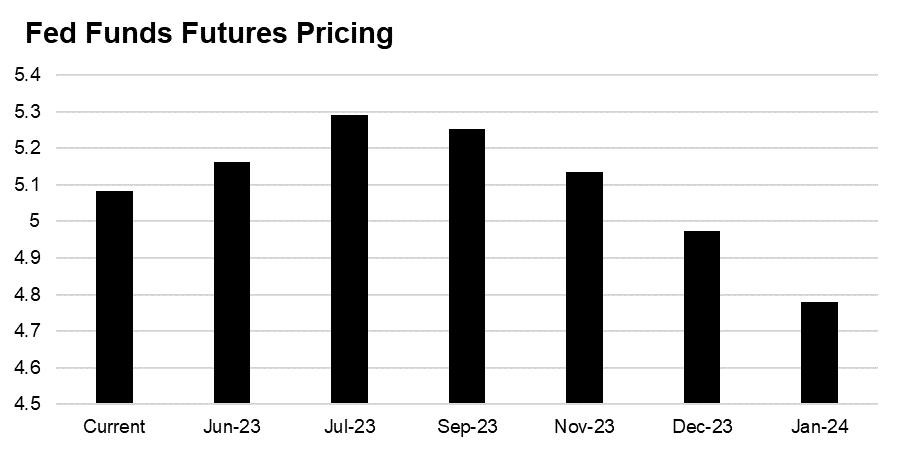
6. Enjoy the Silence: After a busy few weeks of Fed speak, we have now entered the “quiet period” before the Fed’s June 13-14 meeting. The Fed is notably split going into this next meeting, with hawkish members citing strong data as being supportive of another hike (Bullard, Mester), while other members are arguing for a pause and potential resumption of hikes in July given uncertainty (Jefferson, Harker, Goolsbee, and Chair Powel). Importantly, no Fed speakers have endorsed the bond market’s current pricing on interest rate cuts (now starting in September), arguing that rates should stay elevated for “some time”. Note that May CPI will be released on June 13, which could impact the Fed’s decision and messaging coming out of the meeting.
7. Walking on Sunshine: Strong U.S. economic data and rallies in risk assets have led to jumps in both U.S. economic surprises (readings above 0 indicate data coming in stronger than forecasted) and U.S. financial conditions (readings above 0 indicate financial conditions that are easy and stimulative to economic growth). In 2022, these readings would have troubled the Fed, fearing that strong data and easy conditions could exacerbate their fight against inflation. As inflation continues to moderate (but remain elevated and sticky above their 2% target), will the Fed have less urgency to push back on this economic strength and financial easiness?
8. End of the Line: One of the key dynamics for 2023 risk-asset returns has been a boost to liquidity driven by the drawing down of the Treasury General Account, or their cash balance held at the Fed (this dynamic detailed here). Now that the debt ceiling is nearly resolved, the Treasury will need to replenish this cash balance, resulting in a potential issuance of $1 trillion of bills. This could drain liquidity from markets and the economy, presenting a headwind for historically liquidity-sensitive parts of the market (Growth, Technology, low quality, etc.). Regardless of how quickly the TGA is replenished, being near the zero lower bound suggests that we are at the “end of the line” for this to be a continued source of market-boosting liquidity.
9. And I’m Telling You I’m Not Going: The U.S. labor market remains resilient with continued strength in payrolls (Friday’s May jobs data delivered another upside surprise to payrolls), while job openings remain elevated well above pre-pandemic levels and even ticked higher in the latest April reading. There are some cracks emerging in the labor market, such as Friday’s increase in the unemployment rate to 3.7%, a moderating Quits rate (more people quitting jobs is a sign of a strong labor market), and a Bloomberg analysis using the Sahm rule (a 50 bps increase in unemployment over the 12-month low) indicates that 16 U.S. states are seeing rising unemployment with conditions consistent with being in a recession. Wage growth remains strong at 4.3%, well above the pre-pandemic average (2010-2019) of 2.4%, and a key reason why the Fed continues to argue for higher-for-longer interest rates.
10. Steady As She Goes: We continue to watch high yield bond spreads closely for signs of economic weakness (high yield spreads are a measure of the extra compensation that junk bond investors demand to take on the risk of lending to riskier companies). Though high yield is not mirroring the degree of optimism seen in the equity market (high yield spreads remain above their 2023 lows), these spreads remain somewhat contained below their 2022 highs. Rising high yield spreads will be an important coincident indicator of weaker economic conditions.
Top Points of the Week
By Ben Lope
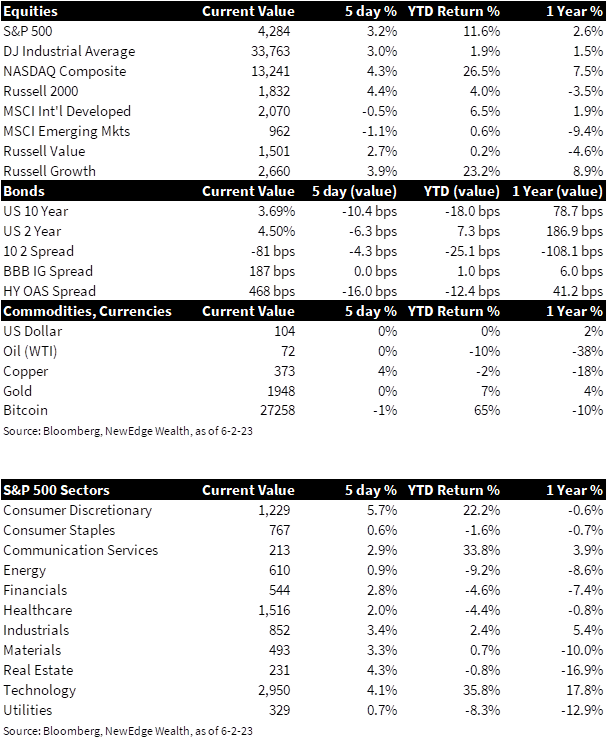
1. US equities move higher, Chinese equities lag: US equities were higher on the week and notched sizable daily gains on Friday. Growth-oriented indices like the NASDAQ and Russell 1000 Growth were again the biggest winners as the names that comprise these indices continued to shrug off higher real rates and expand valuation multiples. Widespread investor enthusiasm pushed the VIX index, commonly referred to as the “fear gauge,” down to 15, near the low for the year and significantly below last year’s average of 23. Ex-US equities were mostly down, with Chinese equities notably lower on the back of disappointing manufacturing data released earlier in the week.
2. Yields pop on Jobs Report to end the week mostly flat: US Treasury yields rose Friday morning following the much stronger than expected May jobs report but were still slightly lower on the week. The yield curve measured by the spread between 2-Year and 10-Year yields became slightly less inverted, but remains inverted by 70-75bps, matching levels seen in mid-March.
3. Oil unchanged as OPEC+ meets to discuss output levels: Despite a slight decline at the onset of the week, oil prices rallied on Thursday and Friday to end the week nearly flat, with WTI in the low $70s and Brent in the mid $70s. OPEC+ members are gathered in Vienna to determine if they will enact further production cuts or allow for more time to assess the effects of April’s surprise production cuts. Most market observers are expecting OPEC+ to maintain current output levels.
4. US Jobs Report shows surprising resilience: Data released by the US Labor Department on Friday revealed that nonfarm payrolls increased by 339,000 in May, well above the Dow Jones estimate of 190,000. The unemployment rate increased to 3.7% from April’s 3.4% reading but remains near historic lows. The jobs report showed that in addition to broad based employment gains across sectors, overall wages increased by 4.3% year-over-year, which is consistent with wage growth recorded in recent months. Resilient labor markets and strong wage growth continue to complicate the “hike vs. pause” decision that will be announced at the FOMC’s June 13-14 policy meeting. Following the announcement of Friday’s jobs numbers, the Fed-funds futures implied pricing of a June rate hike jumped to 32% from the previous day’s 20% figure but remains well below the 64% implied probability recorded a week ago.
5. ISM Manufacturing remains in contraction: The Institute for Supply Management (ISM) released manufacturing PMI figures on Thursday that revealed a seventh straight monthly contractionary reading. May’s Manufacturing PMI came in at 46.9, down slightly from April’s reading of 47.1. A reading below 50 indicates contraction. The survey’s measure of prices paid, which is a helpful gauge of inflation in the manufacturing sector, decreased month-over-month, while employment in the manufacturing sector notched an increase over the same period. Next week’s release of the ISM Services PMI will reveal if broad inflation is still being powered by the services side of the economy.
6. Consumer Confidence lower in May: On the “soft data” front, the Conference Board’s survey of US consumers showed that consumer confidence fell to a six-month low. May’s reading of 102.3, down from April’s upwardly revised reading of 10.37, was a result of less optimistic outlooks on employment prospects, current conditions, and expectations for the next six months. “Soft data” pointing to expectations of economic decline continue to bump into “hard data” pointing to economic resilience, which will remain a topic of conversation among financial pundits as we enter the Fed’s quiet period ahead of this month’s highly anticipated FOMC policy meeting.
7. Earnings – Large retailers temper full year guidance: Earnings reports this week from Dollar General (DG) and Macy’s (M) revealed that consumers are reining in their spending and downshifting their product selection as expectations for more difficult economic conditions loom. DG shares fell 20% on Thursday after the company’s CEO lowered its full year outlook and noted that the current environment “has been more challenging than expected, particularly for our core consumer.” During Macy’s earnings announcement on the same day, their CEO echoed a similar sentiment, citing consumers pulling back more than expected to “reallocate” spending from discretionary purchases towards food and essentials, which resulted in a similar paring back of full year top and bottom line estimates.
8. China’s rebound at risk: China’s recovery following the emergence from party leadership’s “zero covid” policy is being called into question after the country’s official manufacturing PMI index remained in contractionary territory for a second straight month. May’s reading of 48.8 indicates that China’s manufacturing sector is sliding deeper into contractionary territory after April’s 49.2 reading. The China Caixin Manufacturing PMI, a private measure of the same sector, actually showed an increased reading from April to May that lifted the country’s manufacturing sector out of contractionary territory, further muddling how the global economy, which relies on China’s manufacturing prowess, should forecast the status and potential knock-on effects of China’s economic recovery.
9. Debt Ceiling negotiations reach resolution: Following a resolution in debt ceiling negotiations between teams representing the Biden administration and House Speaker Kevin McCarthy, both houses of Congress voted to approve the Fiscal Responsibility Act. The bill now goes to Biden’s desk for signature and is expected to be signed into law mere days before the Treasury’s updated forecast of a June 5th “x date.” The Fiscal Responsibility Act suspends the debt ceiling through January 1st, 2025, enacts unspecified spending cuts in domestic programs (excluding Social Security, Medicare, the military, and veteran affairs), and increases the 2024 budget for military spending and targeted veteran programs, among other things.
10. Earnings Recap & Economic Data next week: 99% of S&P 500 companies have reported Q1 2023 earnings, with results broadly above expectations. Overall earnings are on pace to decline 2.1% on the quarter, which would mark the second straight quarter of declining earnings but is well above March 31st consensus estimates for a 6.7% decline in broad earnings. S&P 500 revenues are on pace to grow 4.1% on the quarter, which is higher than initially expected but would mark the lowest quarterly revenue growth since Q4 2020. Notable economic announcements next week include ISM Services PMI and Factory Orders on Monday, the Fed’s report on Consumer Credit on Wednesday, and weekly jobless claims on Thursday.
IMPORTANT DISCLOSURES
Abbreviations: AI: artificial intelligence; Brent blend: a blend of crude oil extracted from oilfields in the North Sea between the United Kingdom and Norway. It is an industry standard because it is “light,” meaning not overly dense, and “sweet,” meaning it’s low in sulfur content; Bullard: James Bullard, President of the Federal Reserve Bank of St. Louis; Caixin China General Manufacturing Purchasing Managers’ Index: one of the first available indicators every month of the strength of the Chinese economy and is based on data compiled from monthly replies to questionnaires sent to purchasing executives in over 500 manufacturing companies; CPI: Consumer Price Index; EPS: Earnings per Share; FOMC: Federal Open Market Committee; Goolsbee: Austan Goolsbee, President of the Federal Reserve Bank of Chicago; Harker: Patrick Harker, President of the Federal Reserve Bank of Philadelphia; ISM Manufacturing PMI: Institute for Supply Management Purchasing Managers Index; Jefferson: Phillip Jefferson, a member of the Federal Reserve Board of Governors; Mester: Loretta Mester, President of the Federal Reserve Bank of Cleveland; OPEC+: a group of 23 oil-exporting countries which meets regularly to decide how much crude oil to sell on the world market; PE: price to earnings ratio, the ratio of share price of a stock to its EPS; PE: price to earnings ratio, the ratio of share price of a stock to its EPS; Powell: Jerome Powell, Chair of the Board of Governors of the Federal Reserve System; Relative Strength Index (RSI): a technical indicator intended to chart the current and historical strength or weakness of a stock or market based on the closing prices of a recent trading period; Sahm Rule: identifies signals related to the start of a recession when the three-month moving average of the national unemployment rate (U3) rises by 0.50 percentage points or more relative to its low during the previous 12 months; Treasury General Account (TGA): Treausry’s cash balance held at the Fed; West Texas Intermediate (WTI) Crude: refers to a grade or a mix of crude oil, and/or the spot price, the futures price, or the assessed price for that oil; colloquially WTI usually refers to the price of the New York Mercantile Exchange WTI Crude Oil futures contract or the contract itself;
Index Information: All returns represent total return for stated period. S&P 500 is a total return index that reflects both changes in the prices of stocks in the S&P 500 Index as well as the reinvestment of the dividend income from its underlying stocks. Dow Jones Industrial Average (DJ Industrial Average) is a price-weighted average of 30 actively traded blue-chip stocks trading New York Stock Exchange and Nasdaq. The NASDAQ Composite Index measures all NASDAQ domestic and international based common type stocks listed on the Nasdaq Stock Market. Russell 2000 is an index that measures the performance of the small-cap segment of the U.S. equity universe. MSCI International Developed measures equity market performance of large, developed markets not including the U.S. MSCI Emerging Markets (MSCI Emerging Mkts) measures equity market performance of emerging markets. Russell 1000 Growth Index measures the performance of the large- cap growth segment of the US equity universe. It includes those Russell 1000 companies with relatively higher price-to-book ratios, higher I/B/E/S forecast medium term (2 year) growth and higher sales per share historical growth (5 years). The Russell 1000 Value Index measures the performance of the large cap value segment of the US equity universe. It includes those Russell 1000 companies with relatively lower price-to-book ratios, lower I/B/E/S forecast medium term (2 year) growth and lower sales per share historical growth (5 years). The BBB IG Spread is the Bloomberg Baa Corporate Index that measures the spread of BBB/Baa U.S. corporate bond yields over Treasuries. The HY OAS is the High Yield Option Adjusted Spread index measuring the spread of high yield bonds over Treasuries.
S&P Equal Weight Index (S&P EWI) is the equally-weighted version of the widely regarded S&P 500® Index, which measures 500 leading companies in leading U.S. industries. The S&P EWI has the same constituents as the capitalization weighted S&P 500® Index, but each company in the S&P EWI is allocated a fixed weight, rebalancing quarterly. VIX is the ticker symbol for the Chicago Board Options Exchange’s CBOE Volatility Index, a popular measure of the stock market’s expectation of volatility based on S&P 500 index options.
Sector Returns: Sectors are based on the GICS methodology. Returns are cumulative total return for stated period, including reinvestment of dividends.
The views and opinions included in these materials belong to their author and do not necessarily reflect the views and opinions of NewEdge Capital Group, LLC.
This information is general in nature and has been prepared solely for informational and educational purposes and does not constitute an offer or a recommendation to buy or sell any particular security or to adopt any specific investment strategy.
NewEdge and its affiliates do not render advice on legal, tax and/or tax accounting matters. You should consult your personal tax and/or legal advisor to learn about any potential tax or other implications that may result from acting on a particular recommendation.
The trademarks and service marks contained herein are the property of their respective owners. Unless otherwise specifically indicated, all information with respect to any third party not affiliated with NewEdge has been provided by, and is the sole responsibility of, such third party and has not been independently verified by NewEdge, its affiliates or any other independent third party. No representation is given with respect to its accuracy or completeness, and such information and opinions may change without notice.
Investing involves risk, including possible loss of principal. Past performance is no guarantee of future results.
Any forward-looking statements or forecasts are based on assumptions and actual results are expected to vary from any such statements or forecasts. No assurance can be given that investment objectives or target returns will be achieved. Future returns may be higher or lower than the estimates presented herein.
An investment cannot be made directly in an index. Indices are unmanaged and have no fees or expenses. You can obtain information about many indices online at a variety of sources including: https://www.sec.gov/answers/indices.htm.
All data is subject to change without notice.
© 2026 NewEdge Capital Group, LLC

