The major shifts in markets over the course of 3Q23 had us thinking about one of the greatest (true) stories in rock and roll history.
Liam Gallagher of Oasis began life having no interest in music, wholly uninterested in his brother Noel’s passion and prowess for songwriting.
One fateful day, Liam was hit on the head with a hammer in a schoolyard and when he returned from his visit to the hospital he started “hearing music differently.” From that point, everything changed for Liam. He joined his brother in Oasis and in an eponymously Supersonic way, catapulted to fame, becoming one of the most iconic British singers of all time.
3Q23 showed that when markets get hit by a hammer of realization, they can begin to hear the music differently and stage supersonic moves.
For fixed income, long bond yields surged higher as the hammer of resilient economic growth and changing supply/demand dynamics challenged broad expectations that yields could move lower (next week we have a deep dive on the bond market coming from Ben Emons who will outline the sources of the jump in yields, the potential paths for yields looking forward, and the implications for fixed income portfolios).
For oil prices, the supersonic move higher in 3Q23 came after a hammer of stronger demand was met by supply restrictions from OPEC+.
For equities, the moves have been less supersonic and have been somewhat measured compared to other asset classes. This leaves us on the lookout for hammers, or catalysts that could change the way that equities perceive the forward outlook to both the upside and the downside. Below we discuss, using the musical stylings of Oasis’ catapulting song “Supersonic”, earnings, valuations, exogenous shocks, leadership, and technicals as we enter the last quarter of 2023.
“But Before Tomorrow”: All Eyes on Earnings Revisions
We think one of the key reasons why equities have been able digest the sharp move higher in long bond yields with relatively mild damage has been thanks to earnings estimates drifting higher over the past two months. Essentially the lift in estimates has buoyed equity optimism and helped offset the pressure on valuations from higher yields.
As we outlined here and here, EPS estimates for large cap U.S. indices have been flat in 2023 and recently began to drift higher, thanks to resilient economic data and the benefit of a small number of large tech/consumer stocks seeing a pronounced lift to estimates.
In order for equities to continue to shrug off higher yields in a measured way, we think earnings estimates need to continue to move higher. However, if we return to earnings estimate cuts, similar to 2022, this would be a key risk to equity markets, denting risk appetite and sparking renewed volatility.
The current consensus for EPS in 2024 for the S&P 500 is $245, reflecting a rather robust +12% growth rate over 2023. This growth rate likely does not include any risk of recession in 2024 (nor did 2023’s numbers, for that matter, which is why 2023 EPS forecasts were not raised even as economists reduced their recession probabilities!). Upside to this growth rate would likely come from economic data continuing to come in much better than expected, but we note that this growth rate already incorporates corporate margins return to their pandemic era peak, an optimistic assumption.
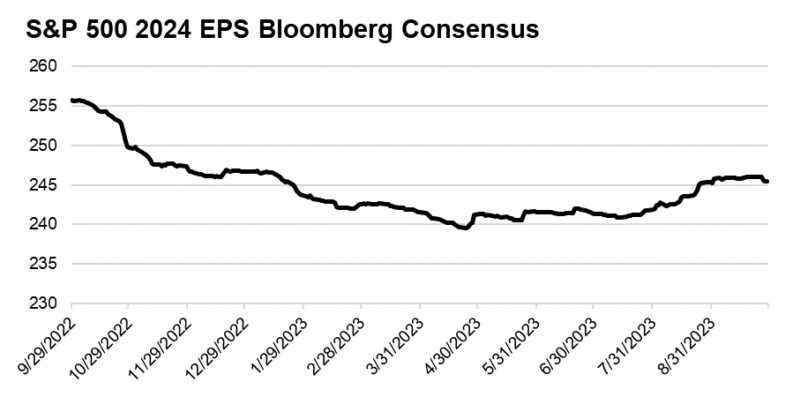
Source: Bloomberg, NewEdge Wealth, as of 9/23/23
“You Can Have it All, But How Much Do You Want It”: Yields, They Don’t Matter Until They Do
All year, equities have been able to shrug off higher yields, staging huge valuation expansion even as expectations for an easier Fed were delayed and long yields staged a mighty ascent.
This turning of the cheek away from higher yields by equity valuations has resulted in the Equity Risk Premium (the earnings yield minus bond yields) reaching a multi-decade low (meaning stocks have not been this expensive versus bonds since before the tech bubble).
We wrote here about why this relative expensiveness likely did not matter for equities to begin 2023, and continue to note that valuations are not a helpful timing tool in the very short term.
Regardless, given yields at these levels, we do think that the ability for valuation to be nearly the entire driver of equity upside from the October 2022 lows has likely run its course. As an example, the Technology sector saw its valuation jump 52% from October to July, returning its forward PE multiple back to its 2021 peak, an eye-popping valuation. The recent sell-off has seen valuations drop by 13%, but just back to an elevated 25x forward.
This raises an important observation that what was priced into equity markets at the end of July was a particularly rosy, “have it all” forecast: strong EPS growth into 2024 averting a recession, along with a shift to easier Fed policy and looser liquidity that could support elevated valuation. As the Fed outlined in its September meeting, strong growth means higher for longer rates, making the combination of both strong EPS and high valuations a more challenging prospect.
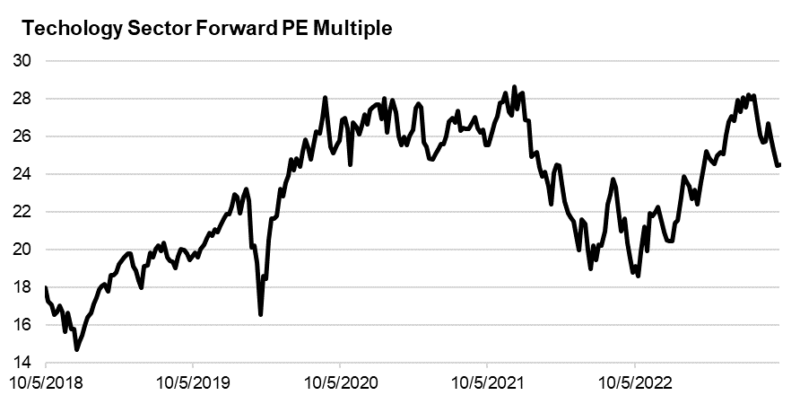
Source: Bloomberg, NewEdge Wealth, as of 9/23/23
“Nobody Can See Him, Nobody Can Ever Hear Him Call”: Exogenous Shocks Keep Risk on its Toes
From labor strikes to government shutdowns, to geopolitical tensions, to commodity prices, the fourth quarter is bound to have its fair share of risk for exogenous shocks.
Many of these shocks could have limited lasting impact (for example, government shutdowns tend not to have a protracted impact on equity markets), while others could be more upsetting for risk.
Oil is the key exogenous shock to watch. A continued jump in oil prices that translates to higher gasoline prices (gasoline prices actually dropped this week due to a surprise build in gasoline inventories) could challenge the Fed’s immaculate disinflation narrative and spark expectations for further rate hikes to come.
“No One’s Gonna Tell You What I’m On About”: Following the Leadership for Signs of Growth Expectations
As we wrote here, equity market leadership will be an important indicator for the future path of growth expectations.
If we begin to see a more durable move in defensive and risk-off sectors outperforming the market, this could be an early sign that growth fears are becoming more pronounced.
We must also watch other markets, such as copper and credit spreads, for indications about growth expectations. Credit spreads, the extra compensation that credit investors receive for lending to risky borrowers, have surprised many with how low they have been able to remain despite equity market leadership. Credit spreads remaining contained is a key reason why we have characterized the recent correction as one driven by rates and valuations and not growth fears.
Lastly, we watch the Technology sector performance closely, as its sheer size in the index makes it a critical participant in an equity market recovery. The Tech sector, despite its lofty valuation, has been able to shake off the recent rise in yields remarkably well. The August relative low of Technology vs. the S&P 500 holding is an important bullish watch item.
S&P 500 Technology Sector Absolute (Top) and Relative to the S&P 500 (Bottom)
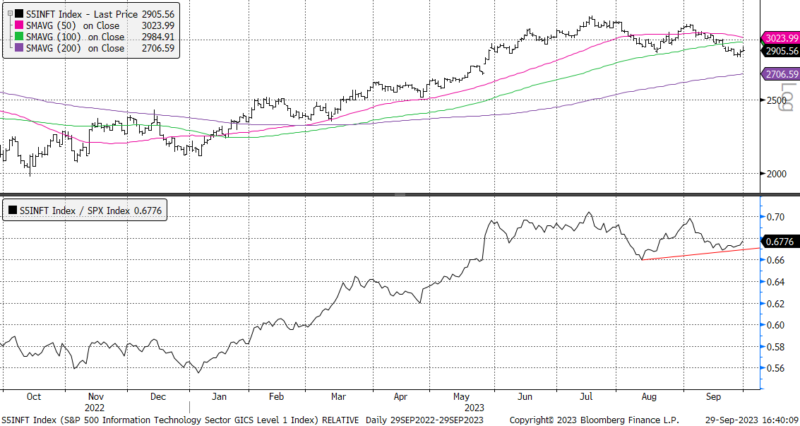
Source: Bloomberg, NewEdge Wealth, as of 9/23/23
“He Lives Under a Waterfall”: Respecting the Technicals
The good news for equity investors is that the traditional seasonal rough patch that markets have been wading through in the past two months is set to end around mid-October. Of course, this seasonal improvement does not guarantee a beloved Santa Claus rally, when markets soar into year-end on a positioning chase, but it does help remove a headwind compared to recent months.
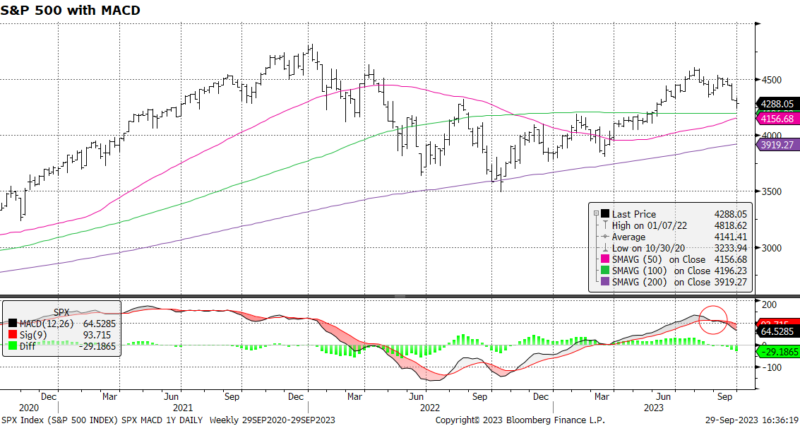
For the short-term, equity markets are nearing levels of being oversold by looking at measures like the percentage of names above their 50-day moving average at only 19%, a level from which markets have historically been able to stage a short-term bounce.
But for the medium-term, the recent equity weakness has significantly dented the equity market’s momentum that it has had since the October 2022 lows. This suggests that the low volatility, powerful rally that brought us +32% off the lows from October to July for the S&P 500 and +53% for the NASDAQ 100 has likely entered a choppier, more directionless phase.
The 200-day moving average (~4,200 for the S&P 500 and ~13,577 for the NASDAQ 100) remains important support for these indices.
S&P 500 Absolute (Top) and Percentage of Members Above Their 50-Day Moving Average (bottom)
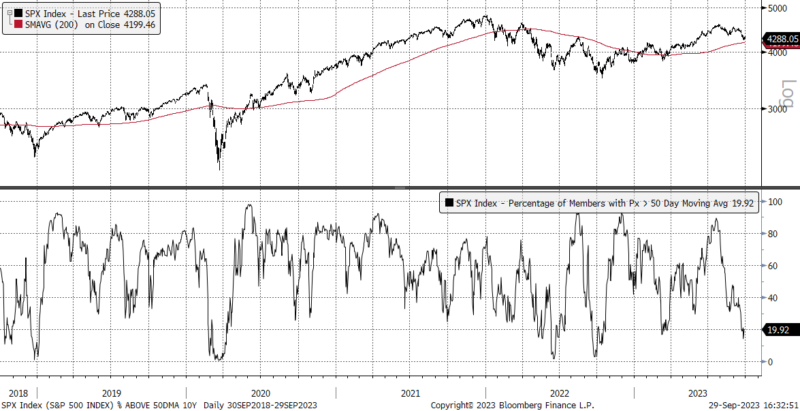
Source: Bloomberg, NewEdge Wealth, as of 9/23/23
Top Points of the Week
By Austin Capasso
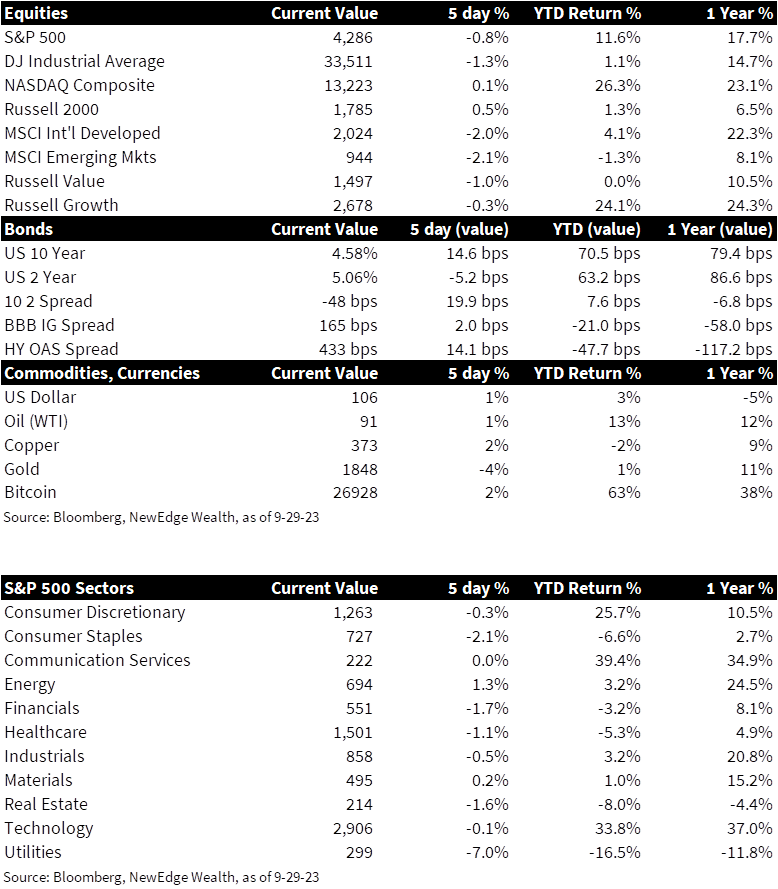
1. Stocks down, yields up – All three of the major US indices saw a sell-off after the latest home sales and consumer confidence reports missed expectations which brought up some concerns about the US economy. The US 10-year is at highs we have not seen since 2007 and seems to be approaching past 5% soon, which is continued to be pushed up from increased government borrowing to spend on industrial subsidies, which pushes up the supply of bonds and so their yields. Historically, higher yields have meant higher stock prices, but it seems that trend has reversed given the current levels of inflation.
2. Oil prices nearing $100 per barrel – A combination of supply cuts from Saudi Arabia and Russia with demand increases from consumers have pushed crude producers to charge nearly $100 per barrel. Brent futures currently sit at nearly $93 per barrel, while WTI Crude oil sits at $91. It will be interesting to see how these price increases weigh into what has been an extremely resilient US consumer to this point.
3. European stocks finish the quarter at 6-month lows – Europe’s benchmark Stoxx 600 closed Wednesday of this week at its lowest level since March 28. This underperformance is directly attributed to growth scares and rising inflation that continue to weigh on sentiment across the continent. Many countries in Europe are seeing economic data come in worse than expected with some having concerns of stagflation.
4. Core PCE had its smallest monthly increase since November 2020 – The personal consumption expenditures price index (PCE), the Fed’s preferred measure of inflation, came in lower than expected this morning. On a headline basis, consumer spending rose 0.4% on the month and 3.5% from a year ago. Core inflation, which excludes the volatile parts of food and energy, increased 0.1% on the month versus 0.2% expected, and 3.9% annually which was in line with expectations. The monthly increase marks the smallest tick up since November 2020, which is a good sign for the Fed that inflation is coming down, but they remain in a higher for longer rate regime for now.
5. German 10-year yield reaches 12-year high – The German 10-year yield, which is Europe’s biggest economy and their key yield, hit a 12-year high at 2.87%. This comes with an increase across European government bond yields after investors continue to prepare for a world of higher for longer rate policies from central banks. The sell off rise in rates pushed up treasuries to 16-year highs.
6. US consumer confidence at its lowest level in 4 months – Rising gas prices and higher interest rates contributed to the economic uncertainty felt by consumers in the latest consumer confidence survey. The Conference Board’s Consumer Confidence Index fell for a second consecutive month and marked the lowest level in 4 months at 103. It seems there are growing fears among the US consumer base shown in this soft data. We will be watching how this plays out closely.
7. BOJ steps in to buy government bonds – Japan’s government bonds are set for the worst quarterly sell-off in more than 20 years, which has aided the risk-on rally we have seen this morning. The securities have seen their biggest drop since 1998 and brings into speculation that Japan will end their zero-interest rate policy early next year.
8. UAW Strike update – After a lack of progress in negotiations, the United Auto Workers (UAW) union have decided to strategically expand their strike to a Ford Motor factory in Chicago and a GM plant in Michigan. UAW President Shawn Fain mentioned Stellantis would be spared from any further walkouts. This walkout would add almost 7,000 workers to the roughly 18,000 UAW members already on strike across the big three. The strike is proving to be effective after Stellantis proposed a deal that came closer in line with UAW demands, though it is tough to say how long the strike will last.
9. Q3 earnings update – Jeffries (JEF) and Micron (MU) gave us a look into the state of investment banking/capital markets and the semiconductor sector on Thursday. Broadly, Q3 results were messy for both names, with weaker than expected near-term guidance that hinted at the lofty expectations baked into earnings estimates. The positive spin is that both companies are seeing top line growth accelerating sequentially from the prior quarter, and both acknowledge that the environment is improving.
10. Incoming data next week – The marquee data releases for the week ahead include the ISM manufacturing and services reports, ADP employment report, and a look into the US jobs market. It will be important to see if the jobs market has become less tight, to see if the impact of higher interest rates is working through the economy to lower inflation.
IMPORTANT DISCLOSURES
Abbreviations/Definitions: BOJ: Bank of Japan; Conference Board Consumer Confidence Index (CCI): The Consumer Confidence Index measures how optimistic or pessimistic consumers are regarding their expected financial situation. The CCI is based on the premise that if consumers are optimistic, they will spend more and stimulate the economy but if they are pessimistic then their spending patterns could lead to an economic slowdown or recession; Core PCE: personal consumption expenditures prices excluding food and energy prices; EPS: earnings per share; OPEC+: an OPEC coalition with 10 of the world’s major non-OPEC oil-exporting nations that represents around 40% of world oil production and its main objective is to regulate the supply of oil to the world market; PE: price to earnings ratio, the ratio of share price of a stock to its EPS; West Texas Intermediate (WTI) Crude: refers to a grade or a mix of crude oil, and/or the spot price, the futures price, or the assessed price for that oil; colloquially WTI usually refers to the price of the New York Mercantile Exchange WTI Crude Oil futures contract or the contract itself.
Index Information: All returns represent total return for stated period. S&P 500 is a total return index that reflects both changes in the prices of stocks in the S&P 500 Index as well as the reinvestment of the dividend income from its underlying stocks. Dow Jones Industrial Average (DJ Industrial Average) is a price-weighted average of 30 actively traded blue-chip stocks trading New York Stock Exchange and Nasdaq. The NASDAQ Composite Index measures all NASDAQ domestic and international based common type stocks listed on the Nasdaq Stock Market. Russell 2000 is an index that measures the performance of the small-cap segment of the U.S. equity universe. MSCI International Developed measures equity market performance of large, developed markets not including the U.S. MSCI Emerging Markets (MSCI Emerging Mkts) measures equity market performance of emerging markets. Russell 1000 Growth Index measures the performance of the large- cap growth segment of the US equity universe. It includes those Russell 1000 companies with relatively higher price-to-book ratios, higher I/B/E/S forecast medium term (2 year) growth and higher sales per share historical growth (5 years). The Russell 1000 Value Index measures the performance of the large cap value segment of the US equity universe. It includes those Russell 1000 companies with relatively lower price-to-book ratios, lower I/B/E/S forecast medium term (2 year) growth and lower sales per share historical growth (5 years). The BBB IG Spread is the Bloomberg Baa Corporate Index that measures the spread of BBB/Baa U.S. corporate bond yields over Treasuries. The HY OAS is the High Yield Option Adjusted Spread index measuring the spread of high yield bonds over Treasuries. The STOXX Europe 600 Index is derived from the STOXX Europe Total Market Index (TMI) and is a subset of the STOXX Global 1800 Index. With a fixed number of 600 components, the STOXX Europe 600 Index represents large, mid and small capitalization companies across 17 countries of the European region: Austria, Belgium, Denmark, Finland, France, Germany, Ireland, Italy, Luxembourg, the Netherlands, Norway, Poland, Portugal, Spain, Sweden, Switzerland and the United Kingdom.
Sector Returns: Sectors are based on the GICS methodology. Returns are cumulative total return for stated period, including reinvestment of dividends.
The views and opinions included in these materials belong to their author and do not necessarily reflect the views and opinions of NewEdge Capital Group, LLC.
This information is general in nature and has been prepared solely for informational and educational purposes and does not constitute an offer or a recommendation to buy or sell any particular security or to adopt any specific investment strategy.
NewEdge and its affiliates do not render advice on legal, tax and/or tax accounting matters. You should consult your personal tax and/or legal advisor to learn about any potential tax or other implications that may result from acting on a particular recommendation.
The trademarks and service marks contained herein are the property of their respective owners. Unless otherwise specifically indicated, all information with respect to any third party not affiliated with NewEdge has been provided by, and is the sole responsibility of, such third party and has not been independently verified by NewEdge, its affiliates or any other independent third party. No representation is given with respect to its accuracy or completeness, and such information and opinions may change without notice.
Investing involves risk, including possible loss of principal. Past performance is no guarantee of future results.
Any forward-looking statements or forecasts are based on assumptions and actual results are expected to vary from any such statements or forecasts. No assurance can be given that investment objectives or target returns will be achieved. Future returns may be higher or lower than the estimates presented herein.
An investment cannot be made directly in an index. Indices are unmanaged and have no fees or expenses. You can obtain information about many indices online at a variety of sources including: https://www.sec.gov/answers/indices.htm.
All data is subject to change without notice.
© 2025 NewEdge Capital Group, LLC


